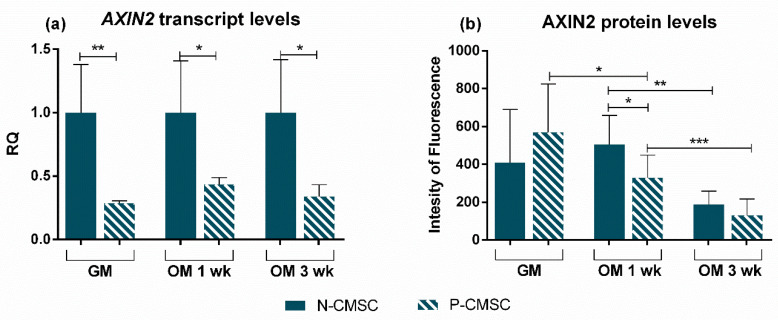
Figure 9.
Comparative expression profiling of AXIN2 gene and protein in N-versus-P-CMSC. (a) Transcript and (b) protein levels of AXIN2 compared in P-CMSC versus N-CMSC, in standard growth conditions (GM) and following one (1 wk) and three weeks (3 wk) of osteogenic commitment (OM). RQ, Relative Quantity (see Methods for details). * p < 0.05; ** p < 0.01; *** p < 0.001.

