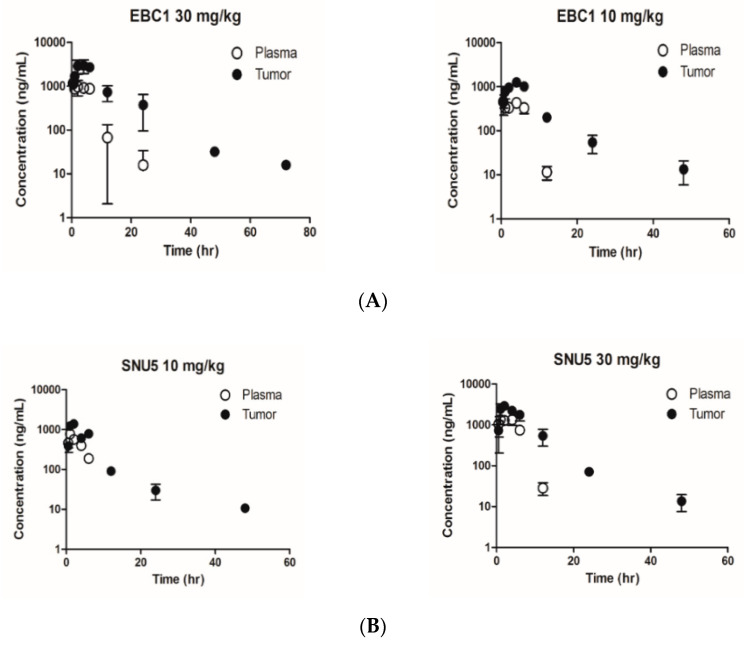
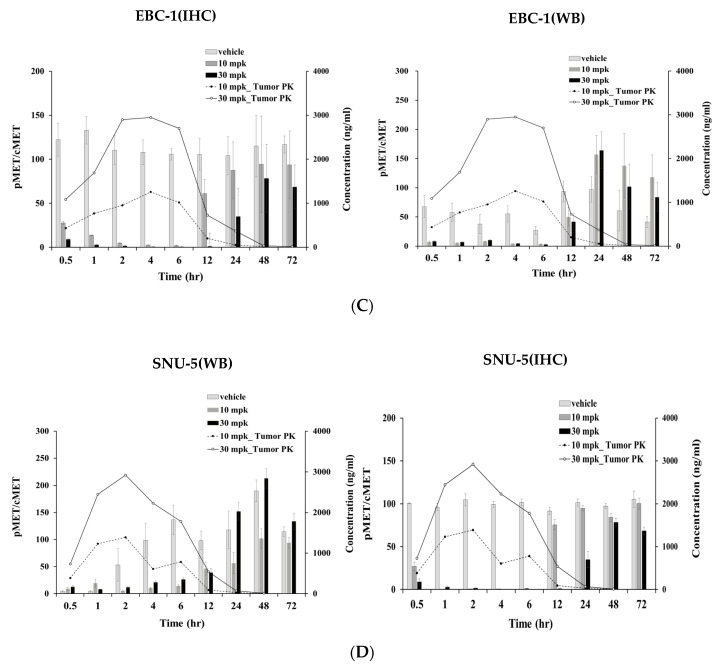
Figure 5.
Pharmacokinetic/Pharmacodynamic correlation of ABN401. Quantitative analysis of ABN401 in plasma and tumor tissues in (A) EBC-1 and (B) SNU-5 models. Based on the tumor to plasma ratio of the AUCinf value for ABN401 (AUCtumor/AUCplasma), Kp,ss values at a dose of 10 and 30 mg/kg of ABN401 were estimated. The dose and duration of ABN401 treatment required to inhibit c-MET phosphorylation were determined by immunohistochemistry (IHC) and Western blotting (WB) in (C) EBC-1 and (D) SNU-5 models. For analysis of the concentration–time relationship of PK/PD, data were integrated.


