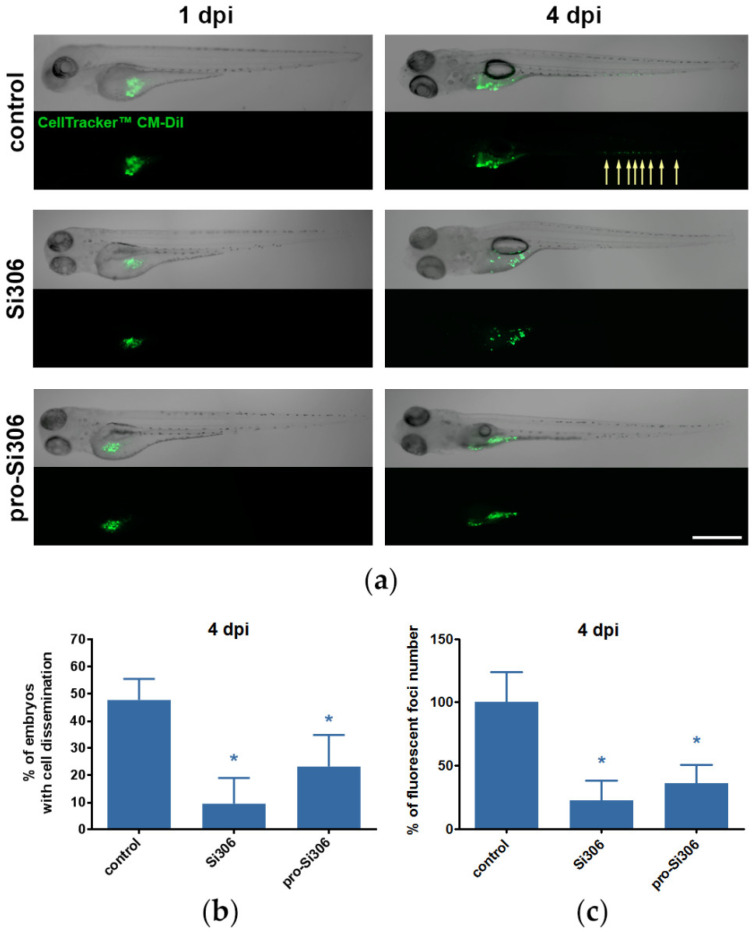
Figure 8.
Si306 and pro-Si306 suppress invasion of GBM cells in vivo. (a) Representative panorama images of U87 xenografts in zebrafish embryo model at 1 dpi (before treatment) and 4 dpi (after 72 h treatment with 2.5 µM Si306 and pro-Si306). Arrows indicate dissemination of cells outside of the yolk sac. Scale bar = 500 µm. (b) Percentage of embryos with cell dissemination after 72 h treatment with Si306 and pro-Si306. (c) Percentage of fluorescent foci number in embryos displaying invasion after 72 h treatment with Si306 and pro-Si306. All values are expressed as mean ± SEM. Statistical significance between treated and control group is shown as * (p < 0.05).

