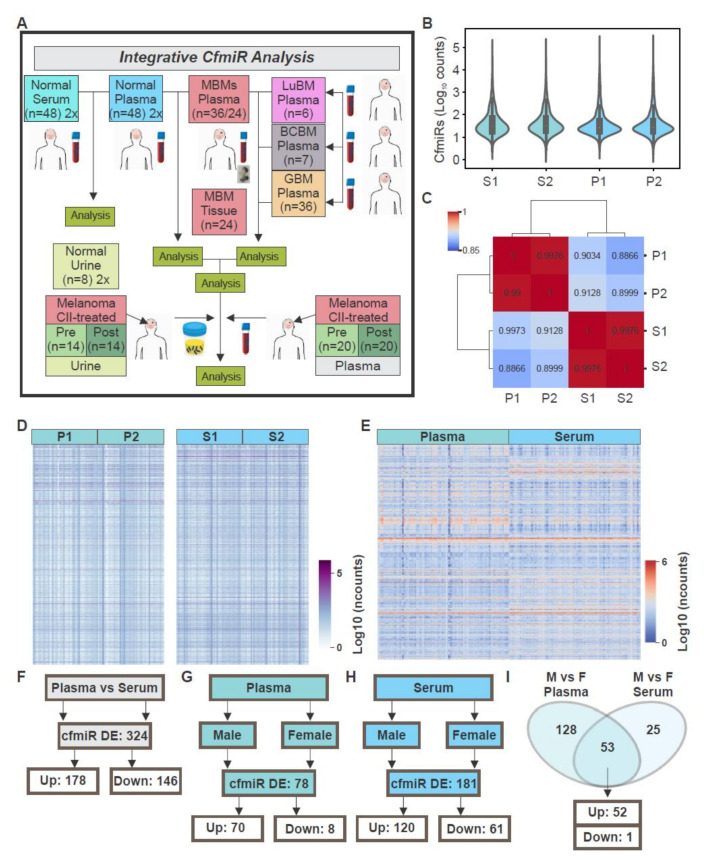
Figure 1.
Comparison of serum and plasma samples from normal healthy donors. (A) Schematic representation of the samples analyzed throughout the study. (B) Cell-free microRNAs (cfmiRs) normalized counts distribution in serum (S1-S2) and plasma (P1-P2) samples for the first (S1 and P1) and second sequencing assays (S2 and P2) respectively. (C) Correlation matrix of cfmiRs analyzed in serum (S1-S2) and plasma (P1-P2) samples for the first (S1 and P1) and second sequencing assays (S2 and P2) respectively. (D) Heatmap showing the normalized counts of cfmiRs observed in plasma (P1-P2) and serum (S1-S2) respectively. (E) Heatmap showing the cfmiRs significantly changing in plasma compared to serum samples. (F) Differentially expressed (DE) cfmiRs in plasma versus serum samples. (G,H) DE cfmiRs in males versus females observed in plasma (G) and serum (H) samples, respectively. (I) Commonly DE cfmiRs in males versus females in serum and plasma samples.

