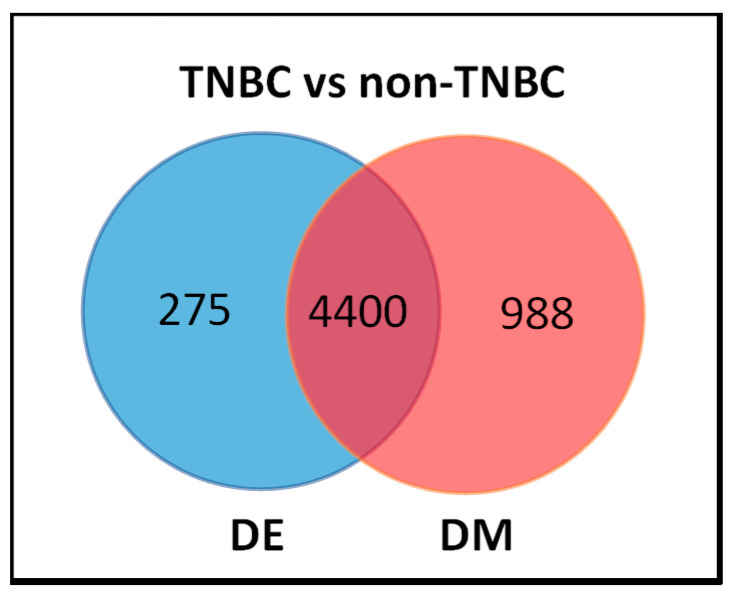
Figure 3.
Venn diagram showing the distribution of genes containing both differentially expressed (DE) and differentially methylated (DM), showing the 4400 genes distinguishing TNBC from non-TNBC (in the interaction), 275 differentially expressed (DE) only, and the 988 differentially methylated (DM) only between TNBC and non-TNBC.

