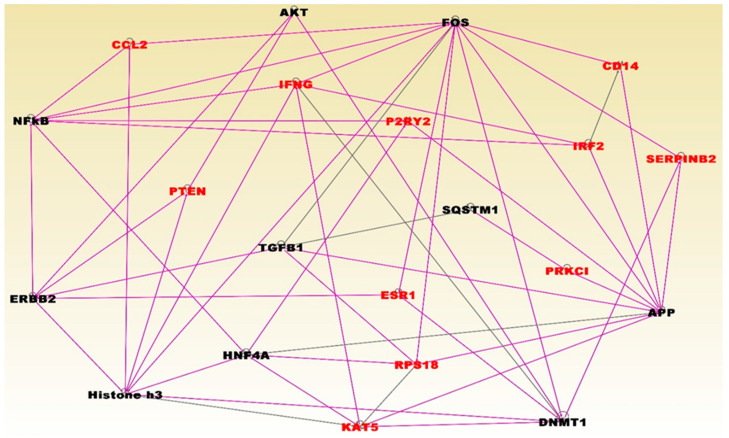
Figure 5.
Molecular networks for genes enriched for somatic and epigenetic variation in TNBC. Genes are shown in nodes and vertices represent functional relationships. The gene symbols in red fonts represent genes containing somatic and epigenetic alterations in TNBC only. Genes in black font are other genes predicted to interact with genes containing somatic and epigenetic alterations. Note that, because the analysis involved merging the top networks containing genes with overlapping functions, the colors of the lines (vertices) are also overlapping to reflect this. Pink and back lines represent interactions among somatic and epigenetic altered genes (red fonts), and with predicted genes in black fonts.

