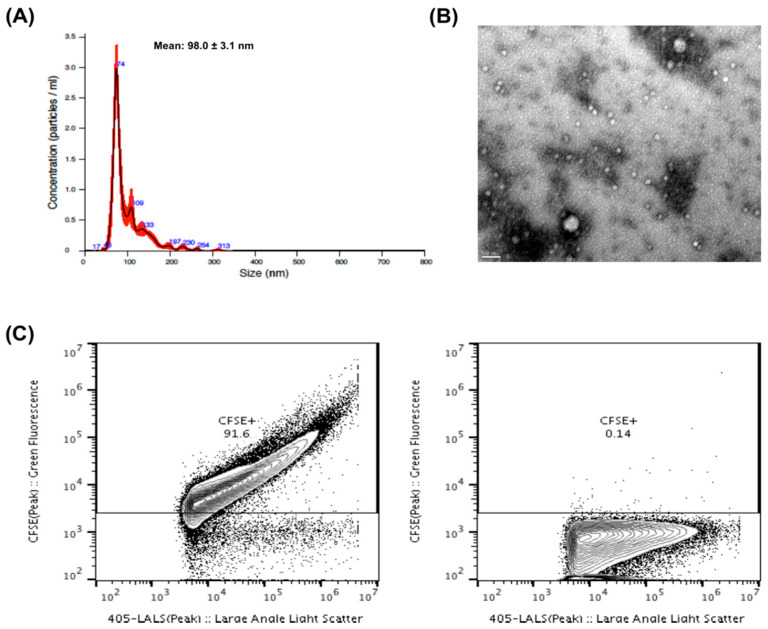
Figure 1.
(A) Nanoparticle tracking analysis (NTA) of EVs derived from plasma of ccRCC patients. The red error bars indicate ± 1 standard error of the mean. (B) Transmission electron microscopy (TEM) of EVs from purified platelet-free plasma (PFP). The TEM image was acquired in the Histology and Electron Microscopy platform from I3S Porto using a Transmission Electron Microscope Jeol JEM 1400. (C) Proportion of fluorescent EVs as observed by flow cytometry from a sample EV isolate derived from a patient, either previously stained with CFSE (left panel) or without previous staining (right panel).

