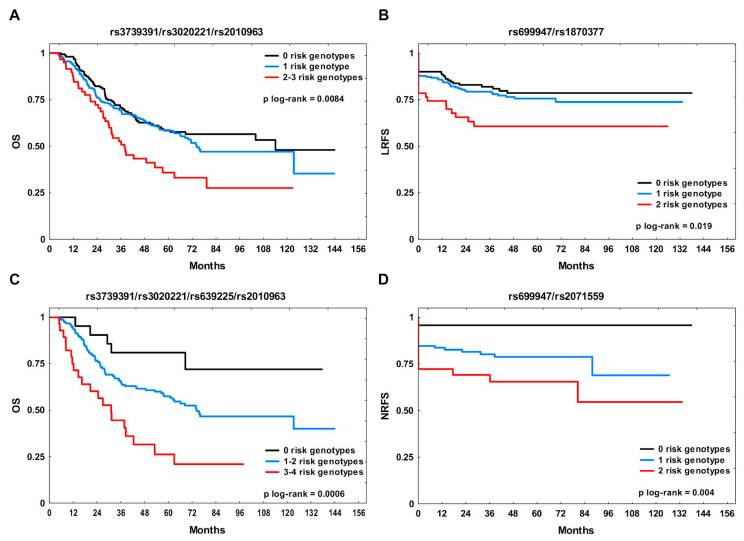
Figure 1.
The Kaplan–Meier plots according to the number of risk genotypes for the studied endpoint. (A) Overall survival (OS) and (B) local recurrence-free survival (LRFS) in the whole study group; (C) OS and (D) nodal recurrence-free survival (NRFS) in the combination treatment subgroup (RT + CHT).

