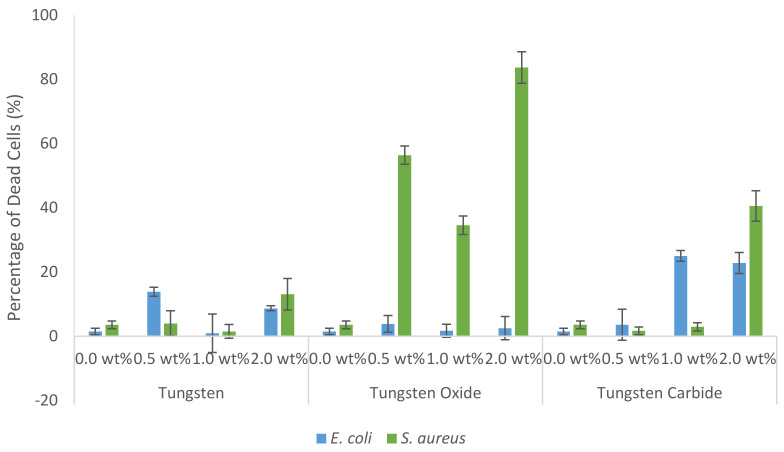
Figure 3.
Graph showing the proportion of dead bacterial cells after 24 h incubation with 0.5, 1.0 and 2.0 wt % of tungsten, tungsten oxide and tungsten carbide. 0.0 wt % represents the untreated control group. Results gathered using flow cytometry in conjunction with LIVE/DEAD BacLight Bacterial Viability and Counting Kit. Error bars represent standard deviation, n = 3.

