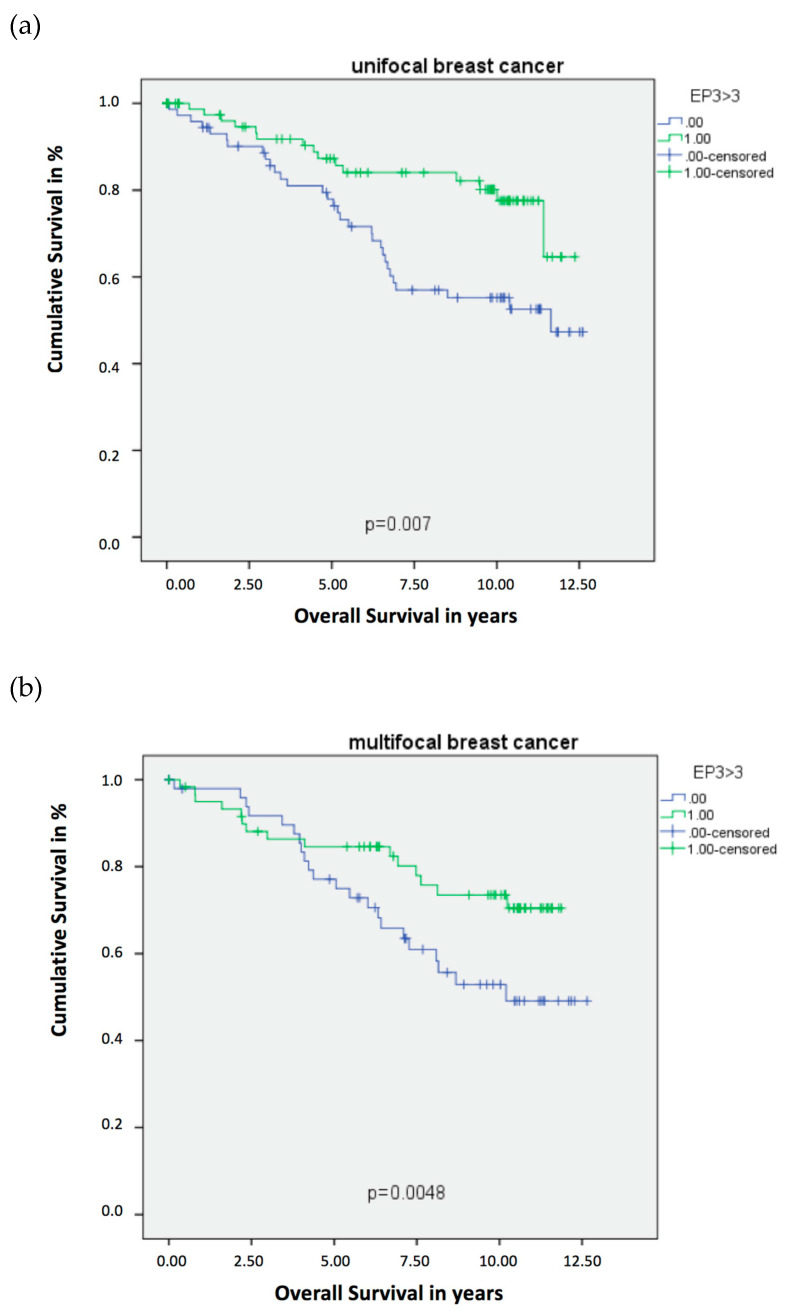
Figure 1.
Kaplan–Meier survival analysis among EP3 positive and negative patients. Blue graph: EP3 receptor negative patient cohort (immune-reactive score of Remmele and Stegner (IRS) < 3). Green graph: EP3 receptor positive patient cohort (IRS > 3). (a) Overall Survival of patients with unifocal BC. (b) Overall Survival of patients with multifocal BC.

