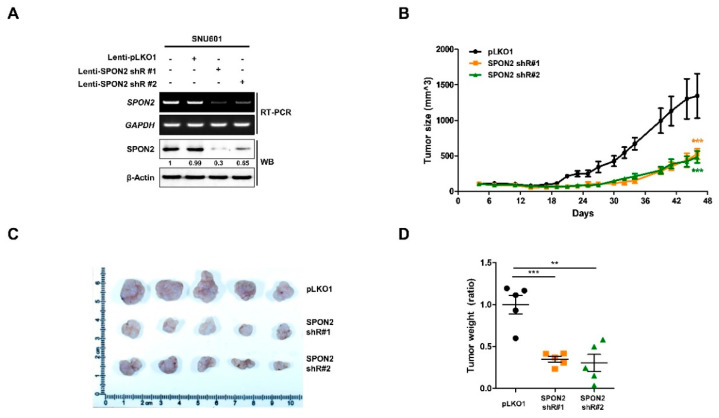
Figure 4.
Effect of SPON2 inhibition on tumor growth in xenograft mice. (A) Stable SPON2-silenced SNU-601 cells were generated by lentivirus infection containing SPON2-specific shRNA #1 or shRNA #2. Lentivirus expressing pLKO1_E.V was used as control. Following infection, decreased SPON2 expression levels were detected by RT-PCR and Western blot analysis. (B) Stable SPON2-silenced cells (50 µL, 2 × 10⁶ cells) with matrigel were implanted in Balb/c nude mice to generate xenografted mice model (each group of pLKO1, SPON2 shR#1, and SPON2 shR#2, n = 5). Tumor sizes were measured three times per week until sacrificed at day 47. (C,D) Xenograft tumors were isolated from the sacrificed mice at day 47. (C) Resected tumor was fixed with formaldehyde and visualized using documented immunostaining method. (D) 5 Tumors of each group were quantified using microbalance and histogram were developed. p-values were calculated using Student’s t-test, and significant differences are indicated by * (** p < 0.01, *** p < 0.001).

