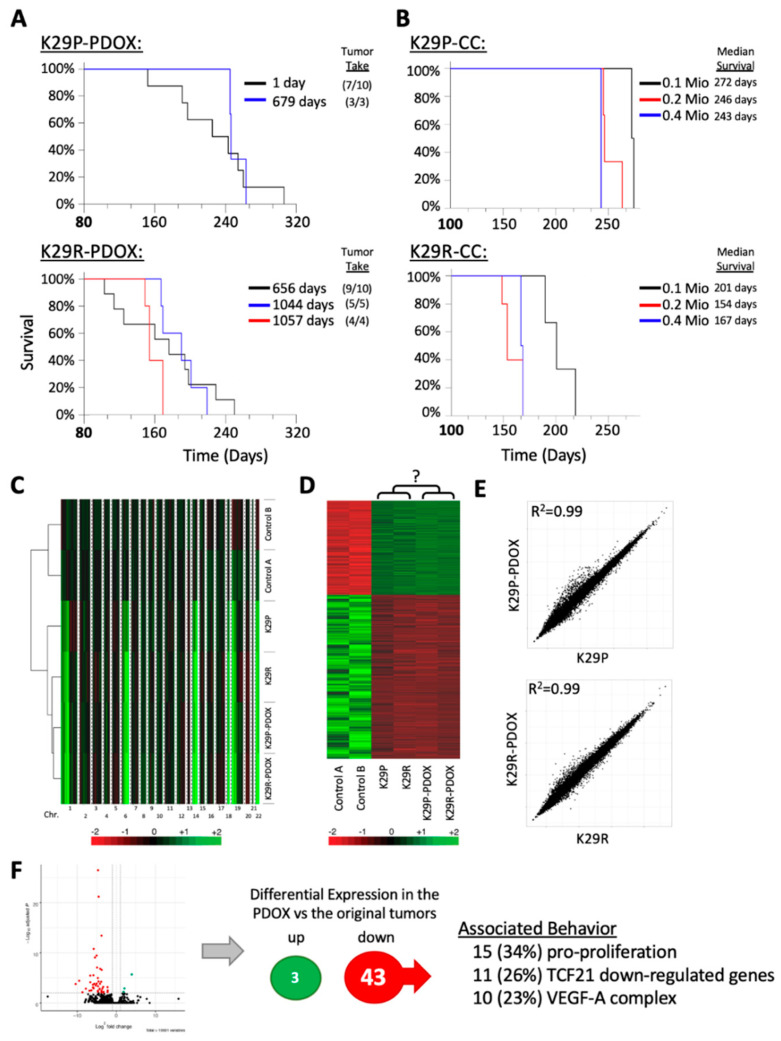
Figure 2.
Tumorigenicity validation and molecular analysis. (A) Kaplan–Meier survival analyses from fresh and cryopreserved patient tumor cells (1 and 679 days after resection, respectively) as analyzed by log-rank analysis. Tumor take rate (xenograft formed/total mice implanted) are presented in parentheses. (B) Influence of initial number of implanted tumor cells, ranging from 0.l million (0.1 Mio) to 0.4 million (0.5 Mio), on animal survival. (C) Heatmap showing DNA copy number analysis of patient tumors and xenografts in comparison with two normal cerebral tissue samples (derived from diffuse intrinsic pontine glioma (DIPG) autopsy). (D) Heatmap showing the 2973 differentially expressed genes in the two PDOX models and the matching patient tumors using two normal cerebral tissues as references. (E) Pair-wise comparison of the original tumor gene expression profiles to the xenograph tumor gene expression profiles. The original and the PDOX expression signatures are highly similar. (F) Volcano-plot of differentially expressed genes between PDOX and original tumors. (Right side) Summary of the differentially expressed genes of the two xenographs compared to the original tumors (FDR ≤ 0.01) and their associated behavior. Abbreviations: patient derived orthotopic xenograft (PDOX); false discovery rate (FDR).

