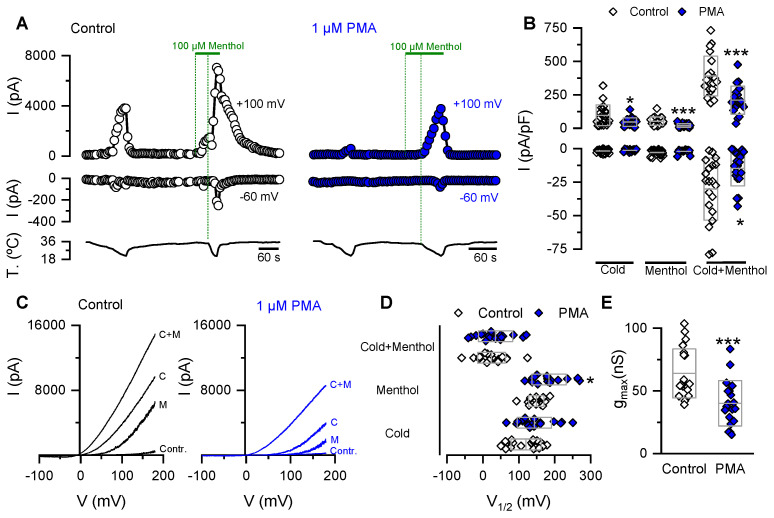
Figure 2.
PKC activation reduces the gmax in HEK-293 cells expressing mTRPM8 channels. (A) Time course of whole cell current development at +100 and −60 mV in HEK-293-mTRPM8-myc stable cell line preincubated for 10 min with (right panel) or without (left panel) 1 µM PMA. (B) Scatter plot with mean ± S.D. of all values corresponding to the maximal current density at +100 and −60 mV. Mean whole-cell capacitance for control cells was 14.6 ± 0.6 pF, vs. 15.6 ± 0.6 pF for treated cells, n = 20 and 19, respectively; p > 0.05, unpaired Student’s t test. (C) Whole-cell I–V relationships at 34 °C in control solution (Contr.), at 20 °C in control solution (cold (C)), menthol at 34 °C (M), and menthol at 20 °C (C + M), for each condition. (D,E) Box plot with data points; the center line of the box represents the mean values, whereas the top and bottom of the box represent the SD of V1/2 values (D) and gmax estimated in the cold+menthol condition (E). Statistical significance was assessed with a two-tailed unpaired Student’s t test; * p < 0.05 and *** p < 0.001. Control, n = 20 and PMA, n = 19.

