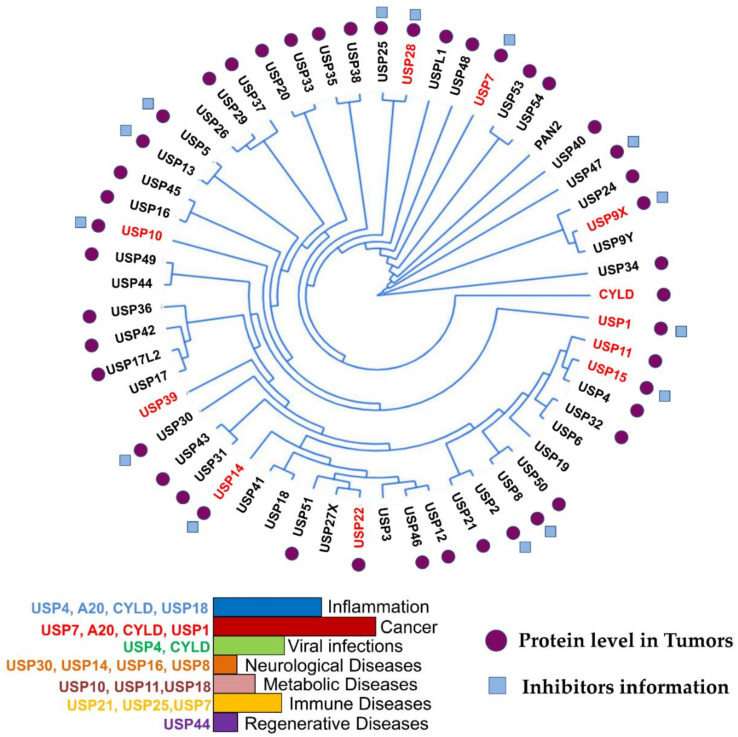
Figure 1.
USP phylogenetic tree. Ubiquitin-specific proteases (USPs) and their association with different diseases are indicated in the histogram. The branches arising from one node represent a clade. The distance between the USPs in the phylogenetic tree describes the relationship among the individuals in this family. DUBs with high expression in different cancers are highlighted in red in the phylogenetic tree. Tumors expressing medium levels of USPs in different cancer types are indicated with purple circles. Blue boxes indicate USPs with identified drugs. This figure is a representation of data obtained from at least 1% of cancer patients [30].

