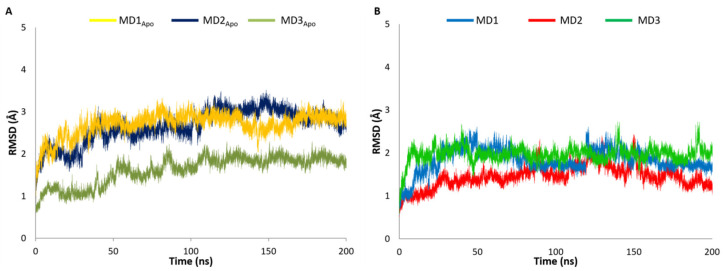
Figure 2.
(A) Root Mean Square deviations RMSD (in Å) with respect to the time in nanoseconds for the CC-Hept-Cys-His-Glu apo-form. The simulations with all the His Nε, Nδ and the structure with six His are in Nδ and one in Nε, correspond to yellow, blue and green lines, respectively. (B) Root Mean Square deviations RMSD (Å) with respect to the time in nanoseconds for the three different conformations of pNPA/CC-Hept-Cys-His-Glu.

