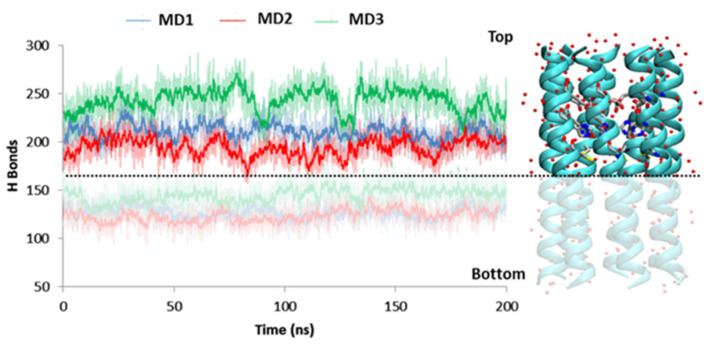
Figure 3.
Hydrogen bonds number (H-bonds) between water molecules and donor/acceptor atoms of side chains inside the channel as function of the time (ns) during the whole trajectories of MD1, MD2, and MD3. The dashed black line separates the number of H-bonds calculated in the top (16–30 residues) and in the bottom region (1–15 residues) of CC-Hept-Cys-His-Glu.

