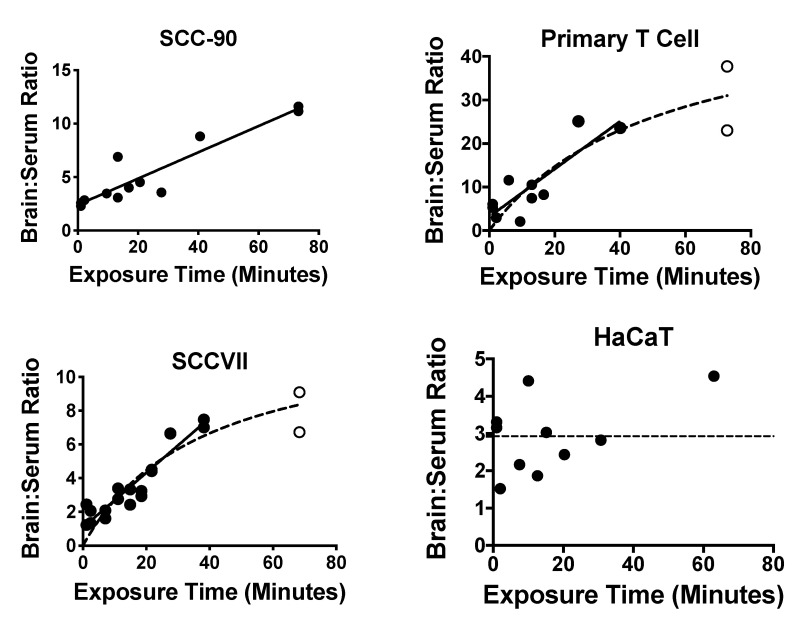
Figure 4.
Examples of patterns for BBB passage and brain accumulation. Brain/serum ratios have been corrected for vascular space by subtracting albumin brain/serum ratios. Left upper panel illustrates continuous linear uptake of SCC-90 exosomes. Right upper and left lower panels illustrate a plateau pattern as seen with primary T cell-derived and SCCVII-derived exosomes. Only the HaCaT exosomes (right lower panel) did not show an increase in the brain/serum ratio with time. The closed circles represent data points describing the linear portion of the curve; the open circles represent data points that departed from linearity. See Table 3 for statistics.

