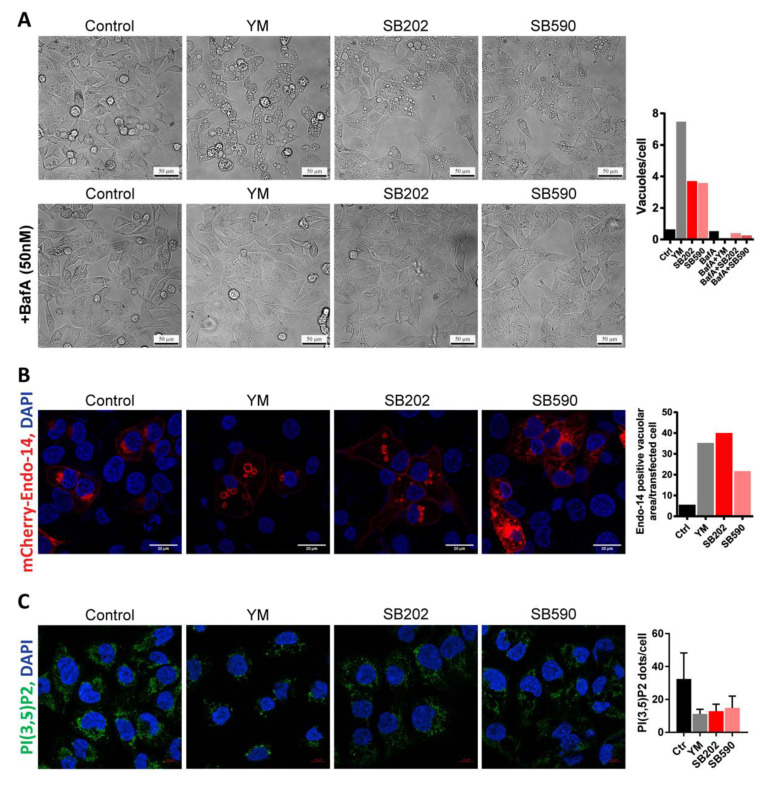
Figure 4.
Phenotype induced in melanoma cells by pyridinyl imidazole compounds partly mimics PIKfyve inhibition. A375 cells were treated 24 h with pyridinyl imidazole inhibitors SB202190 (SB202; 15 μM), SB590885 (SB590; 5 µM), and PIKfyve inhibitor YM201636 (YM; 1 µM). (A) A phase-contrast analysis of the vacuolization induced by the inhibitors and the effect of the cotreatment with bafilomycin A (BafA; 50 nM). Scale bar: 50 µm. Vacuoles per cell were quantified using ImageJ/Fiji (find maxima—bright spots above a certain threshold) and presented in the graph. Dying rounded cells were excluded from the analysis. Three independent experiments showed a similar effect of the addition of BafA. (B) Confocal microscopy analysis of fluorescent protein-labeled endosomal marker (mCherry-Endo-14). Scale bar: 20 µm. The area of mCherry-positive vacuolar structures was quantified in each treatment and plotted in the graph. Three independent experiments showed similar results. (C) Confocal fluorescence microscopy detection of endogenous phosphatidylinositol 3,5-bisphosphate (PI(3,5)P2). Scale bar: 10 µm. Three images of different parts of the same specimen were acquired and analyzed using ImageJ/Fiji. Images were thresholded by the signal intensity, and the amount of PI(3,5)P2 foci per cell was determined. Similar results were obtained in two independent experiments.

