Figure 6.
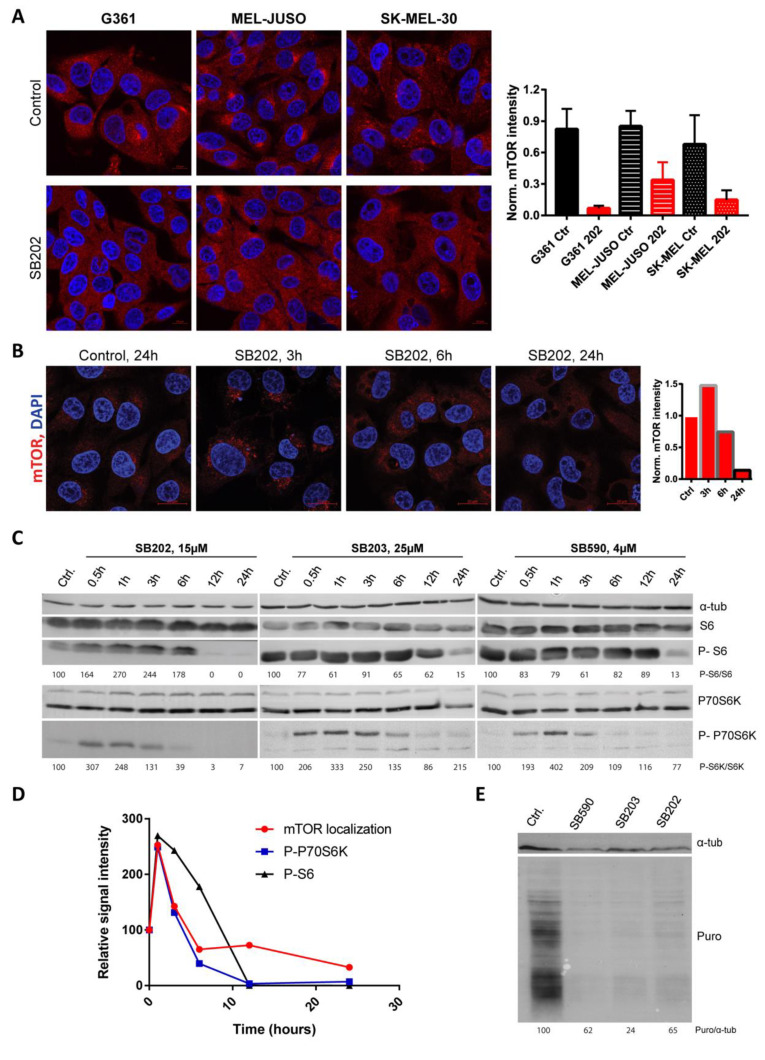
Pyridinyl imidazole compounds promote dynamic changes in mTOR activity in human melanoma cells. (A) BRAF-mutated G361 and NRAS-mutated MEL-JUSO and SK-MEL-30 human melanoma cells were stained for endogenous mTOR after 24 h treatment with SB202190 (SB202; 15 µM). Images were thresholded by a constant value of mTOR intensity, independently for each cell line, and mean mTOR intensity was quantified for three images per condition using ImageJ/Fiji. Scale bar: 10 µm. (B) Localization of endogenous mTOR in BRAF-mutated A375 melanoma cells treated for 0, 3, 12, and 24 h with SB202190 (SB202; 15 μM). Scale bar: 20 µm. The changes in mTOR signal intensity were quantified using ImageJ/Fiji and plotted in the graph as relative values. (C) Time-dependent changes in the activity of mTOR downstream target p70 S6K and phosphorylation of ribosomal S6 protein were analyzed by Western blotting. A375 cells were treated with pyridinyl imidazole compounds SB202190 (SB202), SB203580 (SB203), and SB590885 (SB590). (D) Graph illustrating changes in mTOR localization (Figure 6B) and activity (Figure 6C) at various time points upon SB202190 exposure. (E) Puromycylation assay in A375 cells treated with SB202190 (SB202), SB203580 (SB203), and SB590885 (SB590). Newly synthesized polypeptides were pulse-labeled with puromycin (Puro) and analyzed by Western blot. Tubulin alpha (α-tub) served as a loading control. The ratio between puromycin and tubulin signal intensity was determined using ImageJ/Fiji.

