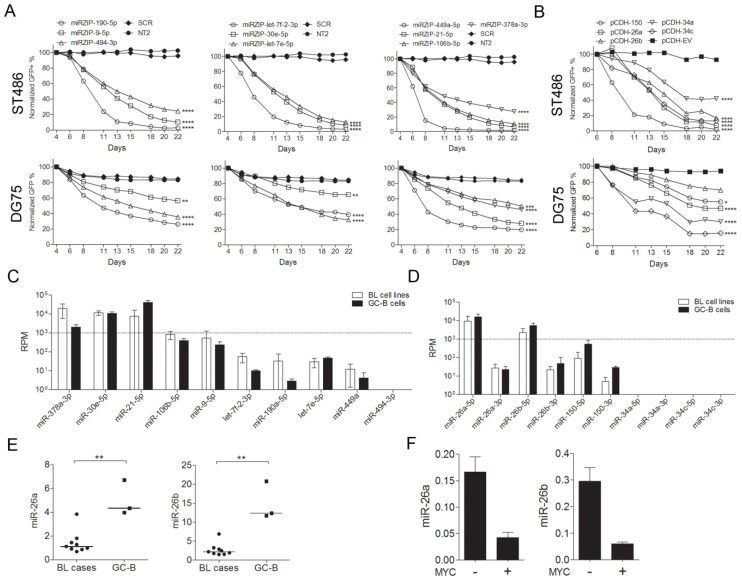
Figure 2.
Validation of screening results and selection of miRNAs for functional experiments. Green fluorescent protein (GFP) growth competition assay of individual (A) miRNA inhibition and (B) miRNA overexpression constructs in ST486 and DG75 cells. The GFP+ cell percentage was measured using flow cytometry for 22 days, and the percentage at the first day of measurement was set to 100%. * p < 0.05, ** p < 0.01, *** p < 0.001, and **** p < 0.0001, based on mixed-model analysis. (C) Small RNAseq-based expression levels of the miRNA candidates from the miRZip pool and the (D) pCDH pool. Shown are the average read counts of 4 BL cell lines (ST486, CA46, DG75, and Ramos) and the average of 3 GC-B cell samples. (E) Expression of miR-26a/b-5p in the BL tissue samples and the GC-B cells, and in (F) the P493-6 B-cells, with and without MYC expression relative to RNU49 by RT-qPCR. ** p <0.01 (Mann-Whitney U-test). The lines represent the median of the miRNA levels.

