Figure 3.
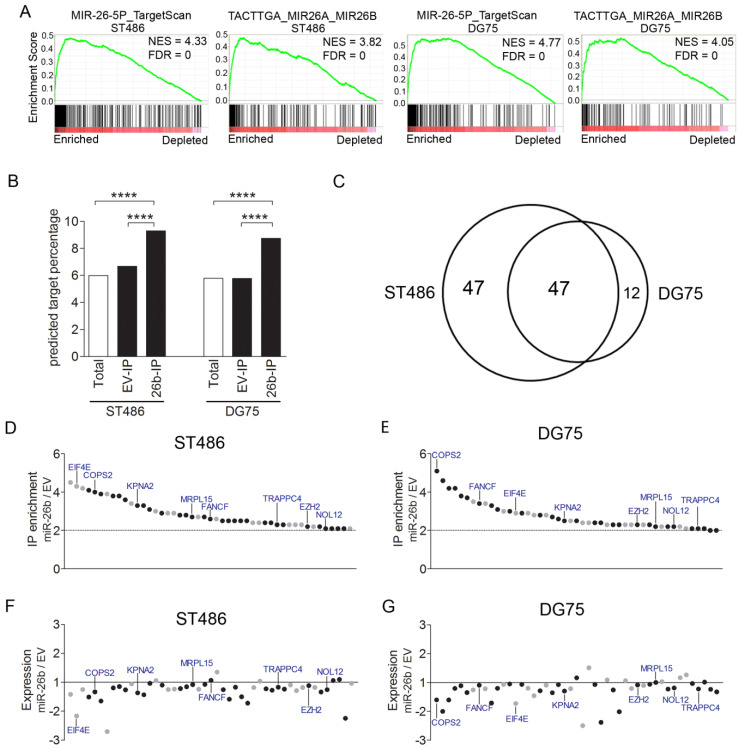
Identification of the miR-26b-5p target genes. (A) Enrichment plots of gene sets for the miR-26-5p targets. Pre-ranked gene set enrichment analysis was performed on average miR-26b IP/T, over empty vector (EV) IP/T fold-change values. (B) Comparison of the percentage of TargetScan-predicted targets of miR-26b-5p among the consistently expressed genes, and Ago2-IP enriched genes. (C) The overlap of the miR-26b-5p targets identified in ST486 and DG75, upon miR-26b overexpression. **** p < 0.0001. (D,E) IP/T ratios of the miR-26b-5p targets identified by Ago2-RIP-Chip upon miR-26b-5p overexpression, relative to EV in ST486 and DG75. The black dots indicate genes with predicted miR-26b-5p binding sites. (F,G) Fold changes in expression of the 47 genes in ST486 and DG75, upon miR-26b-5p overexpression, compared to the EV control. Same order of genes as in D and E. The 8 genes indicated in panels D to G are identified in the CRISPR/Cas9 screen shown in Figure 4A.

