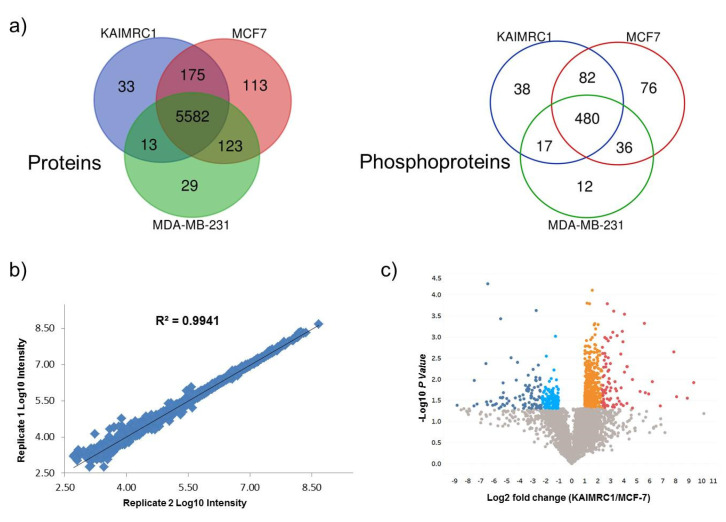
Figure 2.
Quantitative proteomics analysis: (a) Venn diagram illustrated the overlap identified protein (left) and phosphoproteins (right) between KAIMRC1, MCF-7, and MDA-MB-231. (b) Reproducibility evaluation for duplicate biological replicates in MCF7 cell lines using proteins normalized intensities (Reproducibility evaluation of proteins and phosphoproteins for other cell lines can be found in supplementary Figures S2 and S3). (c) Volcano plot display differentially expressed proteins in KAIMRC Versus MCF7: Colored circles are significant proteins (p < 0.05), and red is highly upregulated proteins with fold change ≥ 5. Upregulated protein is plotted in orange with fold change between 2 to 5. Light blue is downregulated protein with fold change ≤ 0.5. Dark blue is highly downregulated protein with fold change ≤ 0.2. Gray circles are nonsignificant proteins. (Volcano plots of differentially expressed proteins and phosphoproteins for the other pairwise comparisons showed in Supplementary Figures S4 and S5).

