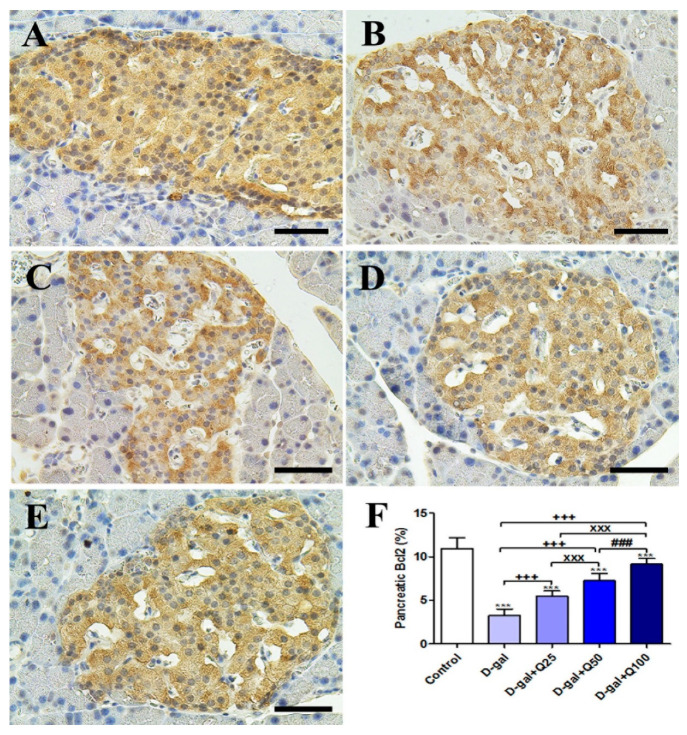
Figure 2.
Immunohistochemical staining of rats’ pancreas with B-cell lymphoma 2 (Bcl2). (A) Negative control group. (B) D-gal group. (C) D-gal+Q25 group. (D) D-gal+Q50 group. (E) D-gal+Q100 group. (F) Quantification of Bcl2 in the pancreatic islets of Langerhans in different groups. Scale bar = 50 µm. Data were analyzed with one-way ANOVA followed by Tukey’s multiple comparison test. *** p < 0.001 vs. control. +++ p < 0.001 vs. D-gal. xxx p < 0.001 vs. D-gal+Q25. ### p < 0.001 vs. D-gal+Q50. Error bars represent mean ± SD.

