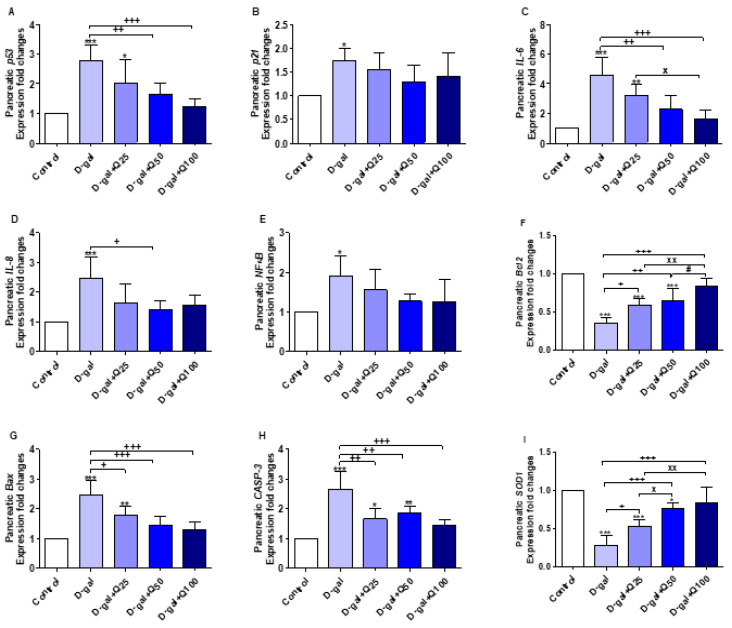
Figure 6.
Expression of fold changes of pancreatic (A) p53, (B) p21, (C) interleukin-6 (IL-6), (D) interleukin-8 (IL-8), (E) nuclear factor-kappa B (NF-κB), (F) B-cell lymphoma 2 (Bcl2), (G) Bcl-2-associated X protein (Bax), (H) caspase-3 (CASP-3), and (I) Cu, Zn-superoxide dismutase (SOD1) mRNA levels: Data were analyzed with one-way ANOVA followed by Tukey’s multiple comparison test. * p < 0.05, ** p < 0.01, and *** p < 0.001 vs. control. + p < 0.05, ++ p < 0.01, and +++ p < 0.001 vs. D-gal. x p < 0.05 and xx p < 0.01 vs. D-gal+Q25. # p < 0.05 vs. D-gal+Q50. Error bars represent mean ± SD. n = 5.

