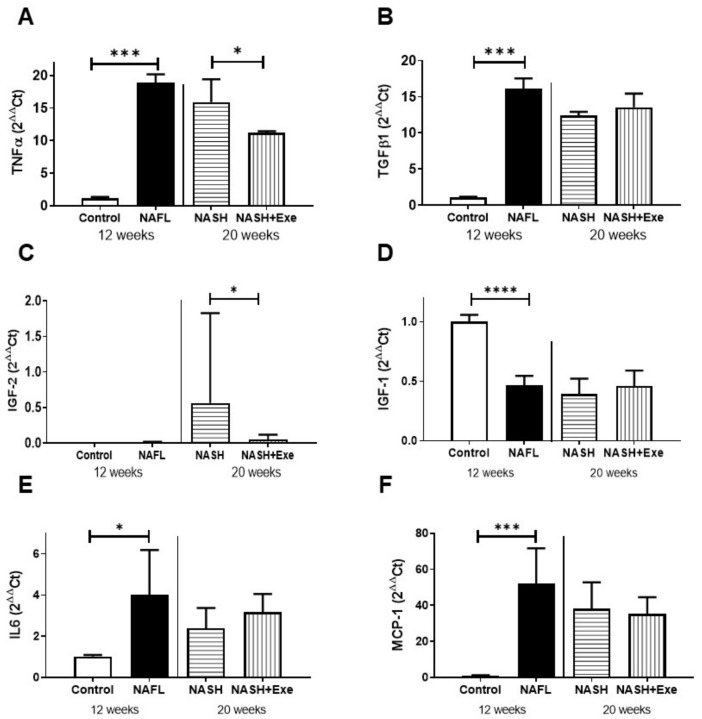
Figure 6.
Effect of exercise on expression of liver biomarkers. Semi-quantitative PCR analysis of mRNA expression relative to β2 microglobulin in livers from control, NAFL, NASH, and NASH + EXE groups. (A) Tumor necrosis factor α (TNFα) was increased in NAFL vs. control (p < 0.001) and decreased in NASH + EXE vs. NASH sedentary (p = 0.05). (B) Transforming growth factor β (TGFβ1) was increased in the NAFL vs. control group (p < 0.001) but not changed in NASH vs. NASH + EXE. (C) Insulin-like growth factor 2 (IGF-2) was increased in the NASH sedentary relative to NASH + EXE. (D) IGF-1 was decreased by CD-HFD. (E) Interleukin-6 (IL6) increased in NAFL. (F) Monocyte chemoattractant protein 1 (MCP-1) increased in NAFL. Groups are described in Figure 1 (unpaired t-test; *p ≤ 0.05; ***p < 0.001; ****p < 0.0001).

