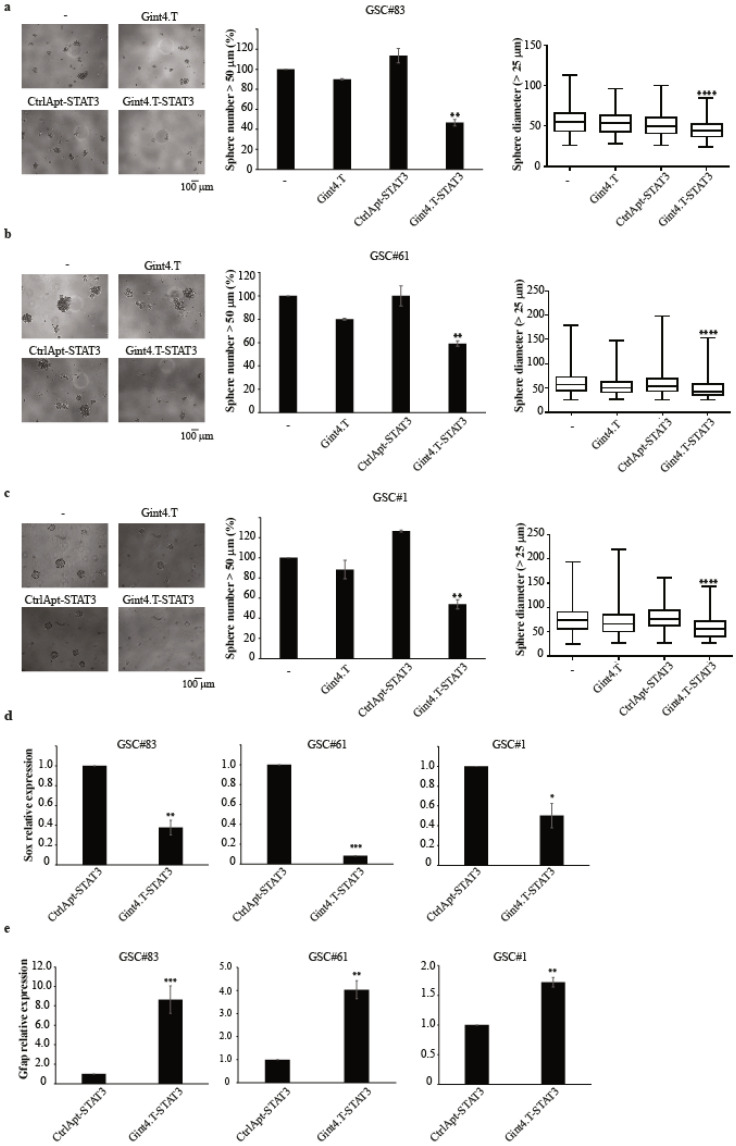
Figure 2.
The effect of Gint4.T-STAT3 on primary GSC tumour sphere formation and stemness. (a–c) Sphere formation of indicated primary GSC-derived tumour spheres (PDGFRβ+) left untreated (−) or treated with Gint4.T, Gint4.T-STAT3, or CtrlApt-STAT3. Left panels are representative micrographs; middle panels are spheres with a diameter > 50 μm and were counted and expressed as percentage relative to the untreated samples (−), set to 100%. Vertical bars depict the mean ± SD; and the right panels are boxplot representations of the diameter measures (spheres with a diameter > 25 μm). Statistics of the conjugate treatment versus the control sample using one-way ANOVA: **, p < 0.01; ***, p < 0.001 ****; p < 0.0001. (d) Levels of Sox were measured by RT-qPCR (left) or immunoblot (right) in primary GSC-derived tumour spheres (PDGFRβ+) treated for 10 days with Gint4.T-STAT3 or control conjugates. Values below the blots indicate quantization relative to the controls, labelled with an asterisk normalized on anti-vinculin signals as a loading control. (e) GFAP levels by RT-qPCR after 10 days of GSC treatment with Gint4.T-STAT3 or control conjugates. In (d,e), statistics for the conjugate treatment versus the control sample were obtained by Student’s t-tests: *, p < 0.05; **; p < 0.01; ***; p < 0.001. Vertical bars depict the mean ± SD on replicates (n = 2). Whole blots of Figure 2d are shown in Figure S7.

