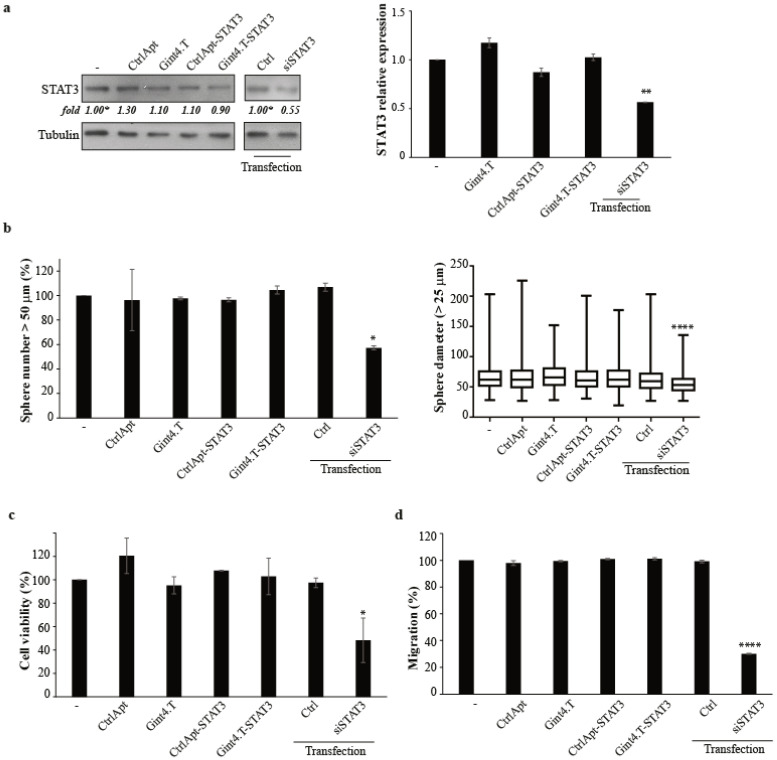
Figure 5.
Gint4.T-STAT3 specificity. (a) GSC#144 (PDGFRβ−) were left untreated (−), treated with indicated aptamer or conjugates (400 nmol/L), or transfected with siSTAT3 (100 nmol/L) for 72 h, as indicated. Left panel: Cell lysates were immunoblotted with anti-STAT3 and anti-tubulin (used as a loading control) antibodies. Values below the blots indicate quantization relative to the control samples (labelled with asterisks) normalized on the loading control signals. Right panel: STAT3 mRNA levels were measured by RT-qPCR. Vertical bars indicate the mean ± SD (n = 2). (b) Sphere formation of GSC#144 (PDGFRβ−) left untreated (−), treated, or transfected, as indicated. Left panel: Spheres with a diameter > 50 μm were counted and expressed as the percentage relative to the untreated samples (−), set to 100%. Mean ± SD (n = 2) is reported. Right panel: Boxplot representation of diameter measures (spheres with a diameter > 25 μm). (c) Cell viability of GSC#144 (PDGFRβ−) following 72 h of indicated treatment (400 nmol/L) or transfection (100 nmol/L). Vertical bars: Mean ± SD (n = 2). (d) Cell migration of GSC#144 (PDGFRβ−) following 24 h of indicated treatment (400 nmol/L) or transfection (100 nmol/L). Vertical bars: Mean ± SD (n = 3). In (c,d), results are expressed as percentages with respect to the untreated cells. In (a–d), the statistics were obtained by one-way ANOVA: *, p < 0.05; **, p < 0.01; ****, p < 0.0001. Whole blots of Figure 5a are shown in Figure S8.

