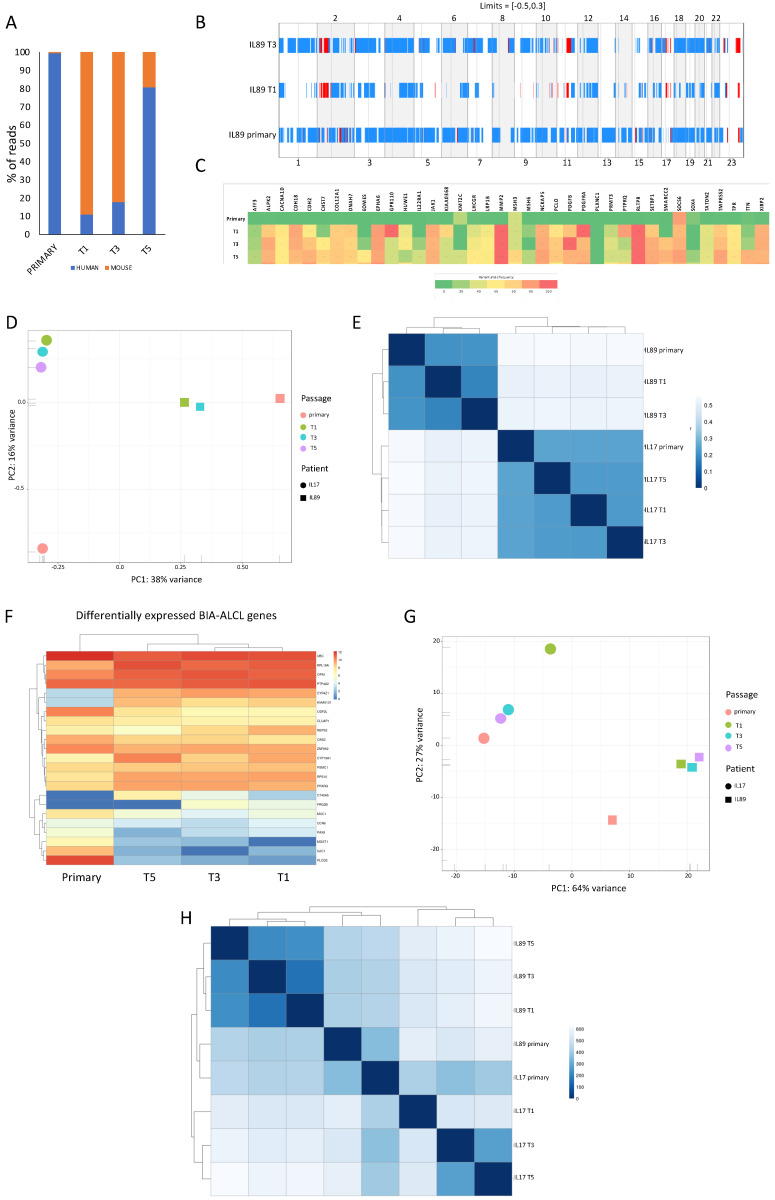
Figure 2.
IL89 PDTX molecular landscape. (A) The percentage of PDTX human vs. mouse content was calculated by normalizing the number of reads from whole exome sequencing (WES) aligned with the human (hg19) or murine (mm10) genomes. Ambiguous reads were excluded from the analysis. (B) Copy number variations (CNV) analysis. Frequency of CNV (Y axis) according to chromosomal regions (X axis) in the IL89 primary sample and PDTX (T1–T3). Blue color indicates the loss of the chromosomal region, while red represents gains. (C) Heatmap of the most significantly mutated genes in IL89 detected by WES. The color-code provided is indicative of the variant allele frequency (VAF). (D) Principal component analysis based on WES data of IL89 vs. IL17 models shows that the primary genomic fingerprints were maintained in PDTX and that different entities have distinct genomic signatures. (E) Unsupervised hierarchical clustering of WES mutational profiles of IL89 vs. IL17. Samples belonging to the same model cluster together. (F) RNA expression levels of signatures of BIA-ALCL-associated genes were mostly consistent between the primary sample and the passages. (G) Principal component analysis based on total RNA sequencing data of IL89 vs. IL17 models shows that the expression landscapes of the primary tumors were maintained in the respective PDTX models and that the two different entities have distinct transcriptomes. (H) Unsupervised hierarchical clustering of total RNA sequencing profiles of IL89 vs. IL17. Samples belonging to the same model cluster.

