Figure 7.
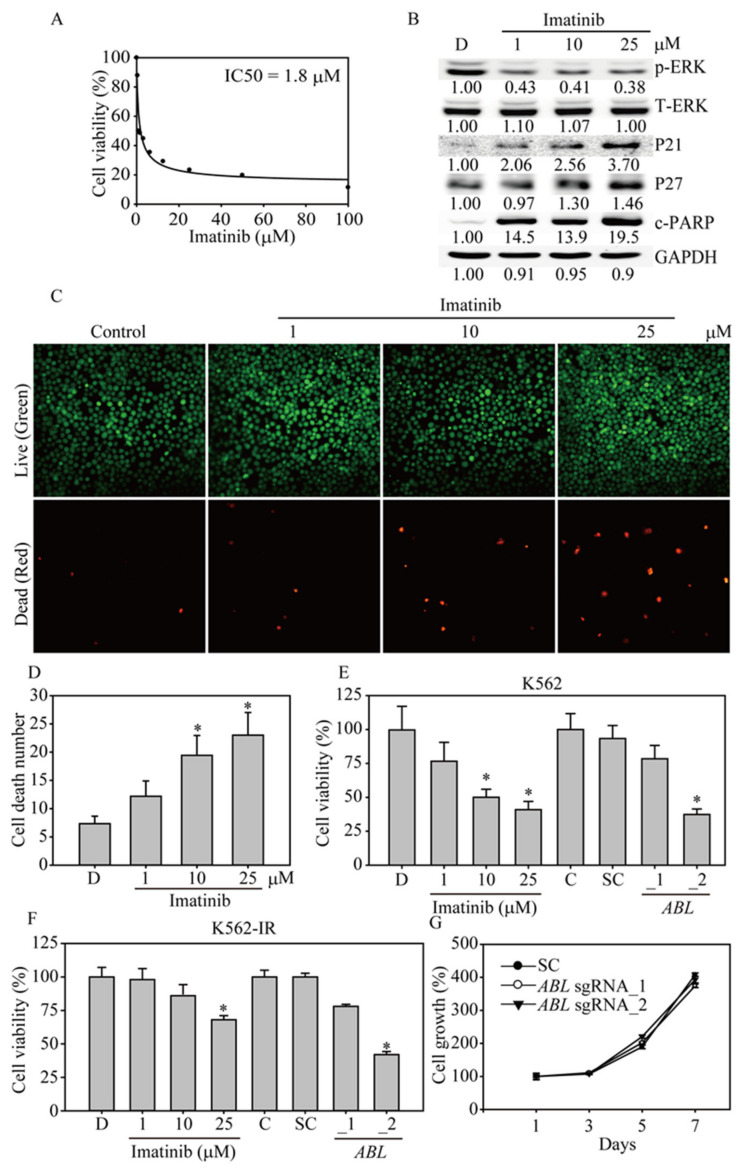
Imatinib inhibits K562 cell survival and induces apoptosis. (A) The IC50 values of the control or imatinib in K562 cells were determined using MTT assays after treatment for 48 h. (B) Imatinib significantly inhibited ERK activation and induced P21, P27 and cleaved PARP (c-PARP) protein expression in a dose-dependent manner, as evidenced by western blot analysis. All the western blotting was measured and quantified by Image J software. (C) The LIVE/DEAD cell viability assay was performed after imatinib treatment of K562 cells for 24 h. Cells were subjected to viability assays to identify live (green) and dead (red) cells at 100× total magnification (D) Cell death after imatinib treatment was analyzed for significance. Comparison of cell viability following imatinib treatment and ABL sgRNA virus infection of (E) K562 cells or (F) K562-IR cells. K562 or K562-IR cells were treated with 1, 10 or 25 μM imatinib or infected with ABL sgRNA_1 and ABL sgRNA_2 virus for 48 h. The cells were analyzed by MTT assays. (G) Cell viability curve of the ABL sgRNA_1- and ABL sgRNA_2-transduced HS27A cells determined by MTT assays. Data are presented as the mean and standard deviation. Data were analyzed with Student’s t-test; all P-values were two-sided. P values less than 0.05 are indicated with an asterisk.

