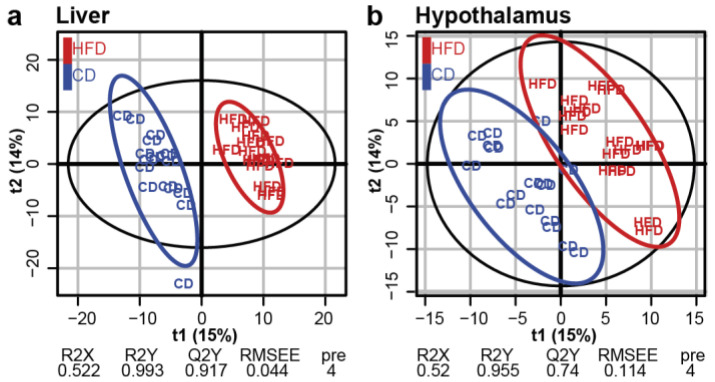
Figure 3.
Post-weaning HFD had a global impact on the liver and hypothalamus metabolomes. Score plots from the PLS-DA classification into HFD and CD groups for the LI (a) and HYP (b). No model was built for WOB. A model is considered robust when the response variance explained (R2Y) is higher than the predictive performance of the model (Q2Y). A model with a Q2Y > 0.5 is considered to have a good predictive performance.

