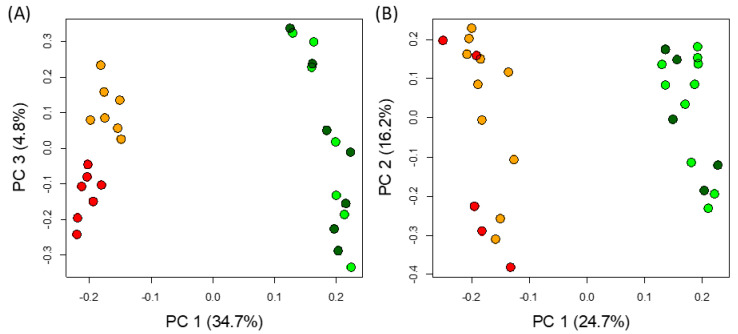
Figure 3.
Unsupervised analysis of all detected features. PCA analysis of features detected in polar (A) and non-polar (B) extracts. Tissue and feeding status are indicated by the colors dark green and light green, showing fed and not-fed leaves, and red and orange, showing fed and not-fed pitchers, respectively.

