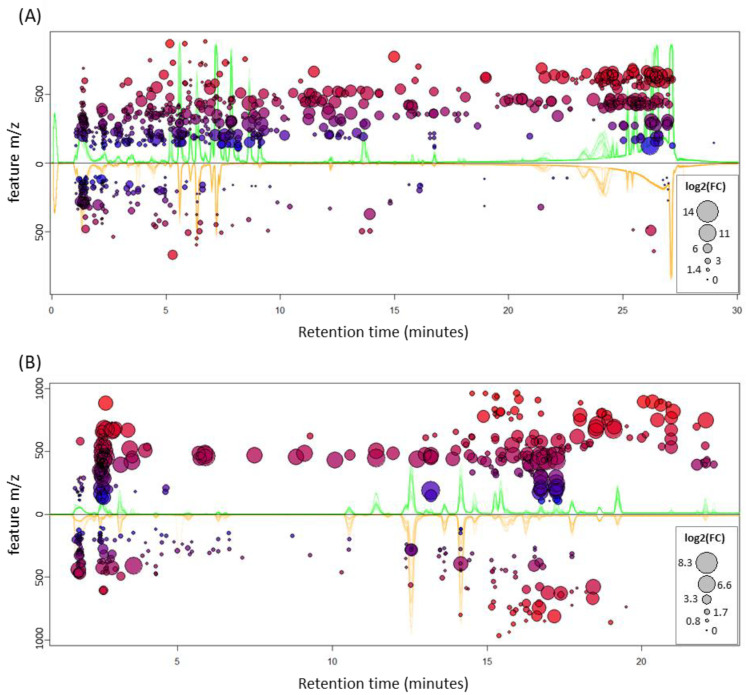
Figure 4.
Mirror plots of differentially accumulated features (DAFs). DAFs (FDR < 0.01) in polar (A) and non-polar (B) extracts are shown for leaf (top) and pitcher (bottom). Circle size depicts the absolute value of the log2 of the average fold change, on the top if it is over-accumulated in leaf, and on the bottom otherwise. Color and y-axis value depict the m/z value of the feature, with blue being low- (100) and red high- (1000) m/z features; the further away from the origin, the higher the m/z, as indicated by the y-axis. The superimposed, raw base-peak chromatograms (BPC) of all runs are shown in the background, colored accordingly: green, all leaf BPCs; orange, all pitcher BPCs.

