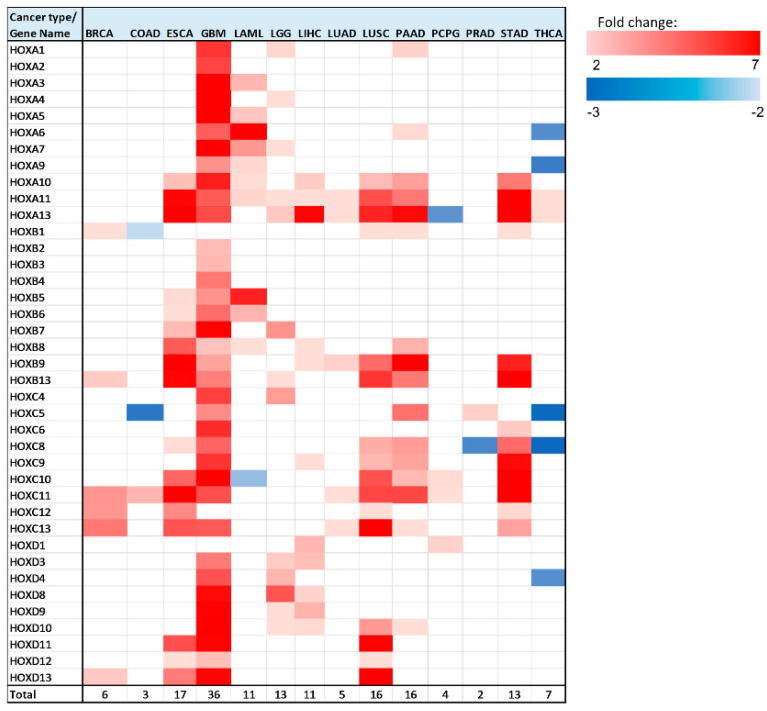
Figure 4.
Heatmap of differentially expressed HOX genes in different cancer types. Gene column includes list of all 39 HOX genes tested in this analysis. The rest of the columns represent the analyzed cancer types. Upregulated genes are marked in red color gradient (light red represents lower fold change), downregulated genes are marked in blue color gradient (light blue represents lower fold change).

