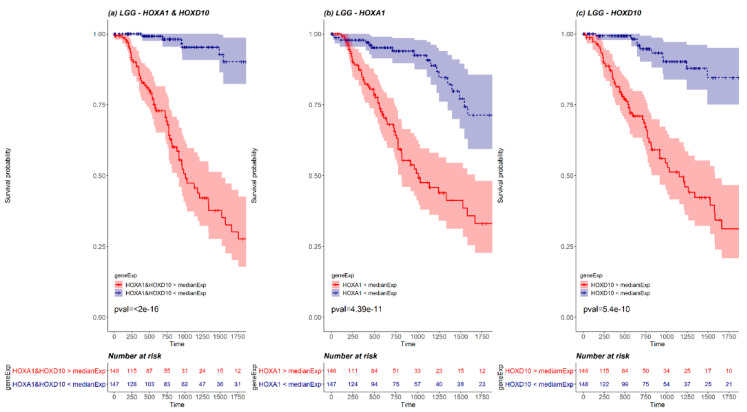
Figure 5.
A KM plot of HOXA1 and HOXD10 pair (a) versus separate KM plots for each of HOXA1 (b) and HOXD10 (c) in LGG. The red line represents the survival of patients with expression higher than median expression, and the blue line represents the survival of patients with expression lower than median expression. The pink and the light blue background of the lines mark the confidence interval. Out of 527 LGG patients, there were 148 patients with both HOXA1 and HOXD10 expressed above LGG median expression (marked in red in the risk table below graph) and 147 patients with both HOXA1 and HOXD10 expressed below LGG median expression (marked in blue in the risk table below graph).

