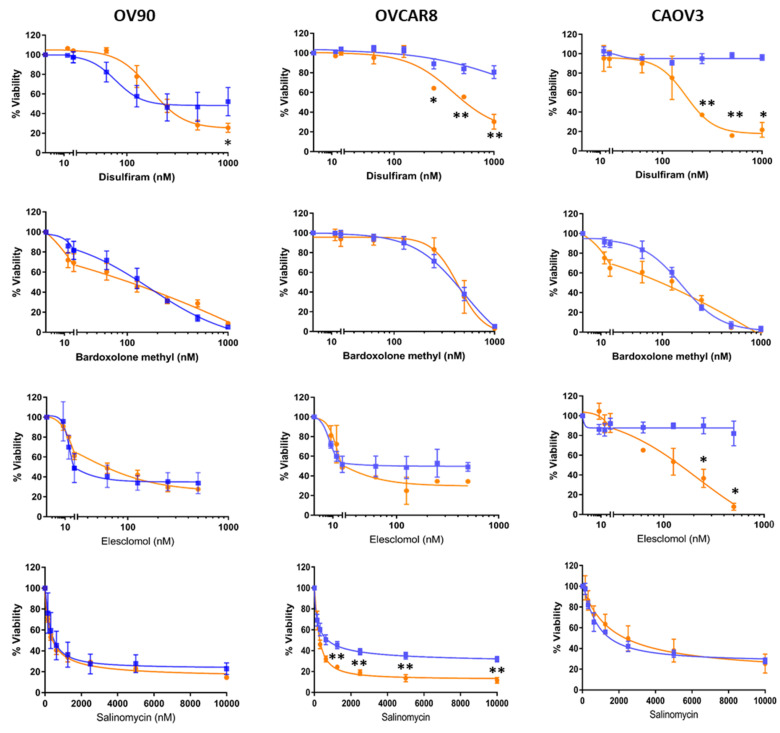
Figure 2.
Confirmation of the candidate drug’s activity against ovarian cancer cells. Dose response curves of selected agents on additional cell lines grown in adherent (blue) or TIC-enriching spheroid (orange) culture conditions. Graphs represent mean and SEM compared to control * p < 0.05, ** p < 0.01.

