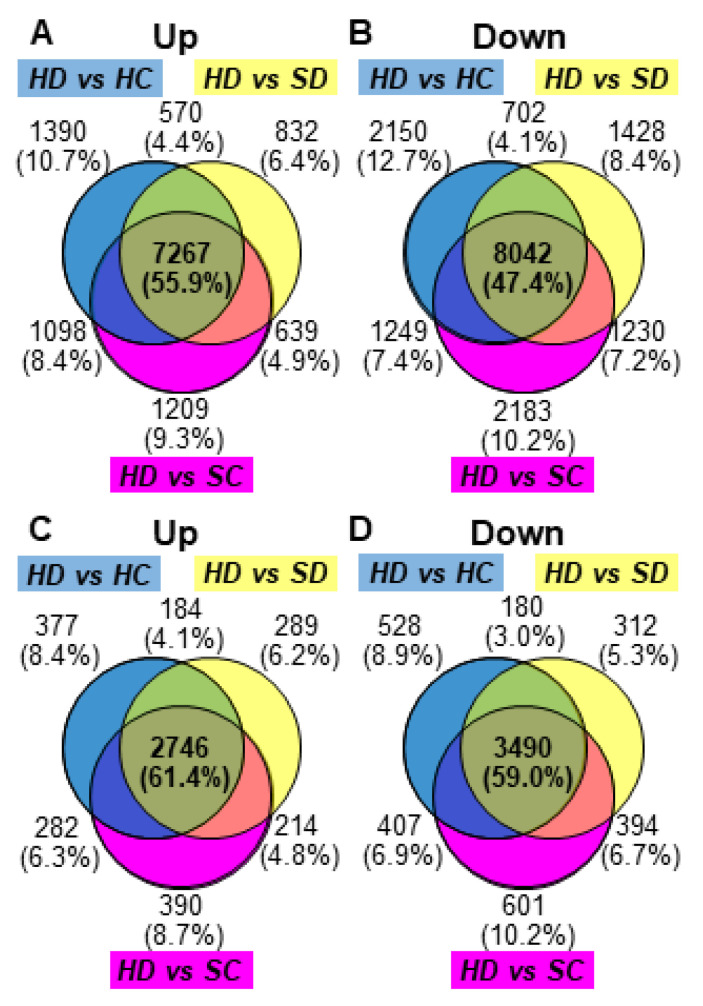
Figure 3.
Venn diagrams of differentially expressed genes. Results from differential expression analysis with DESeq2 were considered in three different comparisons: Dex-treated H-4 vs. control H-4 (HD vs. HC), Dex-treated H-4 vs. Dex-treated SR1 (HD vs. SD), and Dex-treated H-4 vs. Control SR1 (HD vs. SC). The differentially expressed genes (DEGs) were detected using DESeq2 as mentioned in Section 4. Diagrams (A) and (B) show DEGs detected in the analysis with mRNA ID in the reference transcriptome, and diagrams (C) and (D) show those annotated with AGI codes. Diagrams (A) and (C) show numbers of upregulated genes, whereas diagrams (B) and (D) show those of downregulated genes.

