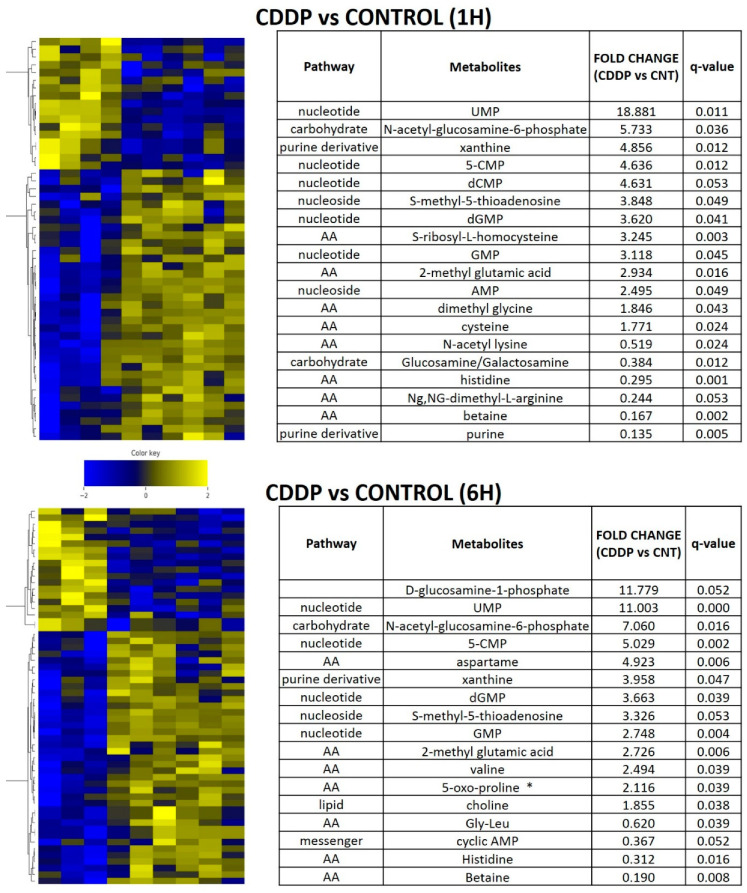
Figure 6.
Acute metabolomic shifts secondary to cisplatin exposure. HN30 tumors were exposed to a single dose of cisplatin (CDDP) 5 mg/kg for 1 or 6 h (h); (control n = 4, CDDP n = 7). Heatmaps indicate metabolite levels which increased and/or decreased in CDDP treatment tumors compared to the control condition (FDR < 0.25). Tables summarize metabolites which demonstrated a statistically significant increase or decrease compared to the control condition. * indicates metabotoxin; MTA- S-methyl-5-thioadenosine.

