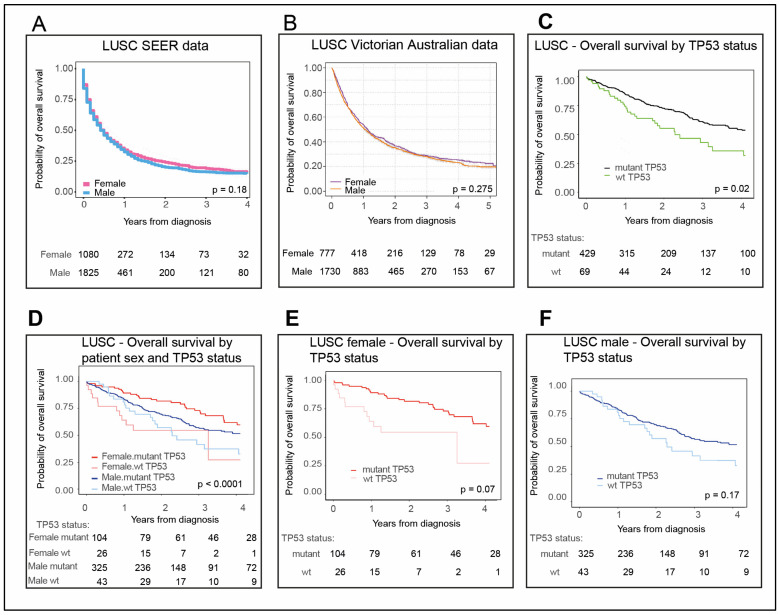
Figure 5.
LUSC patient survival is longer for patients with mutant TP53 than wt TP53. LUSC overall survival data for (A) male (blue) and female (pink) patients in the US SEER datasets. (B) Male (orange) and female (purple) patients from Australian Victorian data. (C) LUSC patient overall survival in TCGA according to either wt p53 (green) or mutant p53 status (black), then for (D) females stratified for wt p53 (pink) and mutant p53 status (red) and males stratified for wt p53 (light blue) and mutant p53 status (dark blue). Also shown separately for (E) females and (F) males. The numbers of patients corresponding to each cohort are tabulated below each plot. The ‘p’ is the p-value for the log-rank test of differences in survival time between cohorts (significant p-value < 0.05). Refer to Section 4. Materials and Methods for description of methodology and datasets utilized in survival analysis.

