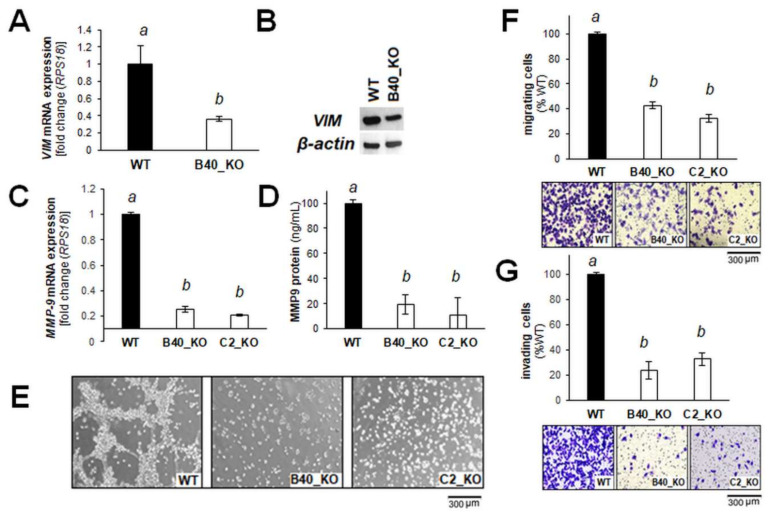
Figure 4.
Genomic GLO1 deletion impairs migration and invasion of A375 malignant melanoma cells. (A) RT-qPCR and (B) immunoblot assessment of vimentin expression (WT, B40_KO). (C) RT-qPCR and (D) ELISA assessment of MMP9 expression (WT, B40_KO, C2_KO). (E) Branching morphology, as assessed by light microscopy (20× magnification; WT, B40_KO, C2_KO; representative images). (F) Transwell migration (WT, B40_KO, C2_KO) and (G) invasion through Matrigel-coated Boyden chambers (WT, B40_KO, C2_KO); bar graphs depicted with representative images (after crystal violet staining of inserts.). The uncropped blots and molecular weight markers of Figure 4B are shown in Figure S3. For bar graph statistical analysis with letter designation see Materials and Methods Section 4.19.

