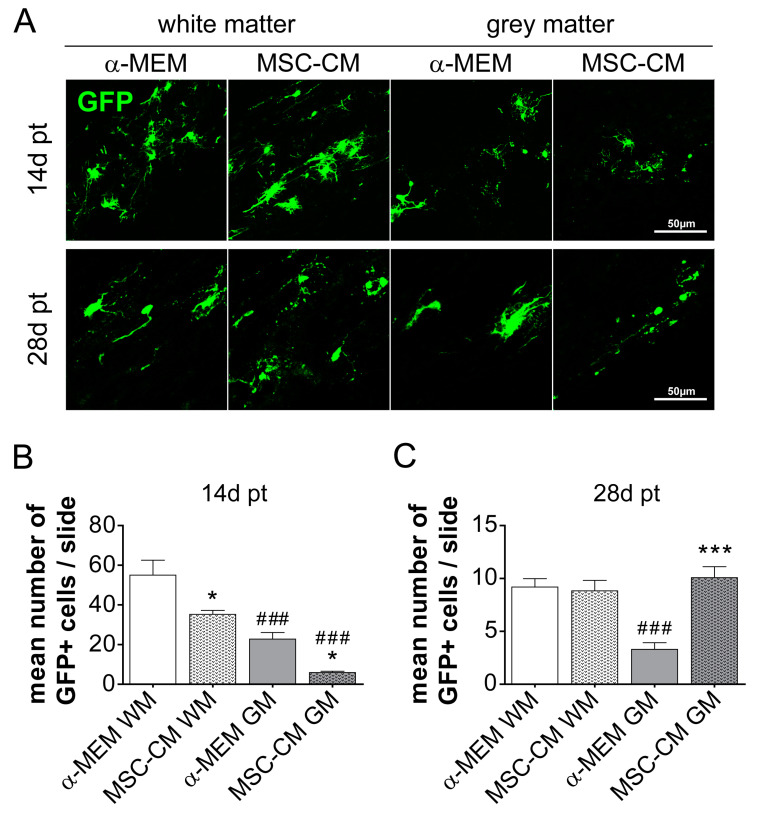
Figure 3.
Survival rate of rat aNSCs after transplantation into the rat spinal cord. (A) Representative images of GFP-positive transplanted cells 14 and 28 days post-transplantation (pt) either in white or grey matter of the rat spinal cord. Corresponding quantifications of GFP-positive cells per slide (a mean of three sections per slide) and animal in white and grey matter at 14 days (B) and 28 days (C). Statistical significance was calculated using a two-way ANOVA with Bonferroni posttest: * p ≤ 0.05, *** p ≤ 0.001 (for comparison between control α-MEM to MSC-CM) and ### p ≤ 0.001 (for comparison between white and grey matter and respective transplantation paradigm). Animal numbers (n): 14 days pt α-MEM n = 4 and MSC-CM n = 5, 28 days pt α-MEM n = 6 and MSC-CM n = 4.

