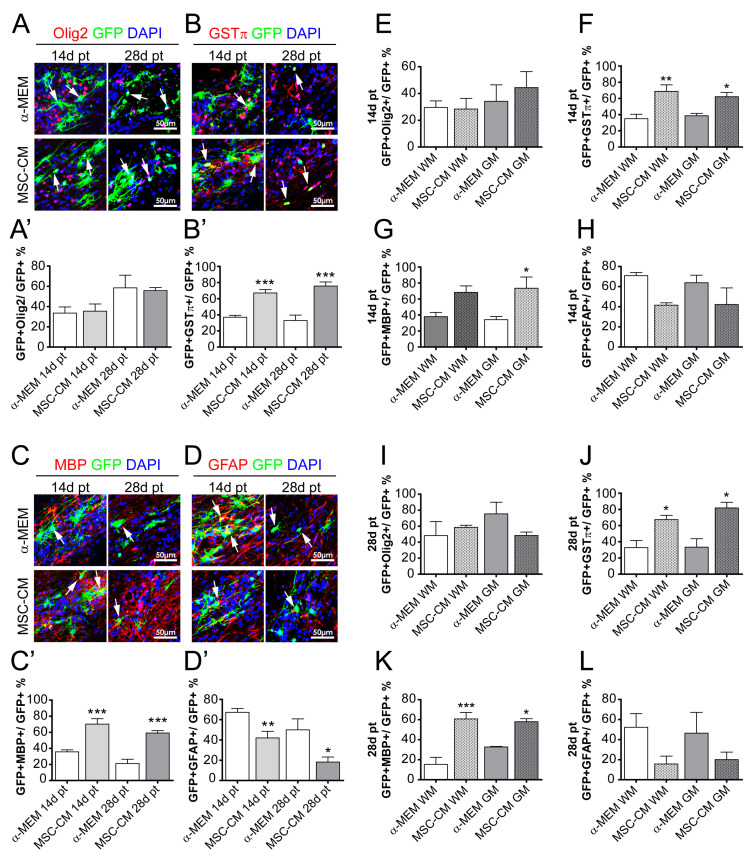
Figure 4.
Accumulation of oligodendroglial characteristics in spinal cord-transplanted aNSCs. Representative pictures of GFP-positive cells expressing Olig2 (A), GSTπ (B), MBP (C), and GFAP (D) at 14 and 28 days post-transplantation and following α-MEM or MSC-CM pre-treatment. The corresponding quantifications (percentage of expressing cells over total number of GFP-expressing cells) are depicted in (A’) for GFP/Olig2- in (B’) for GFP/GSTπ-, in (C’) for GFP/MBP-, and in (D’) for GFP/GFAP-positive cells. (E–L) Quantification and distribution of transplanted GFP-positive cells pre-treated with α-MEM and MSC-CM within white matter (WM) and grey (GM) at 14 and 28 days post-transplantation. Statistical significance was calculated using a two-way ANOVA with Bonferroni posttest: * p ≤ 0.05, ** p ≤ 0.01, *** p ≤ 0.001 (for comparison between control α-MEM to MSC-CM). Arrows point to GFP-positive cells (green) expressing the respective marker proteins (red). Blue nuclei represent DAPI staining. Animal numbers (n): 4–6.

