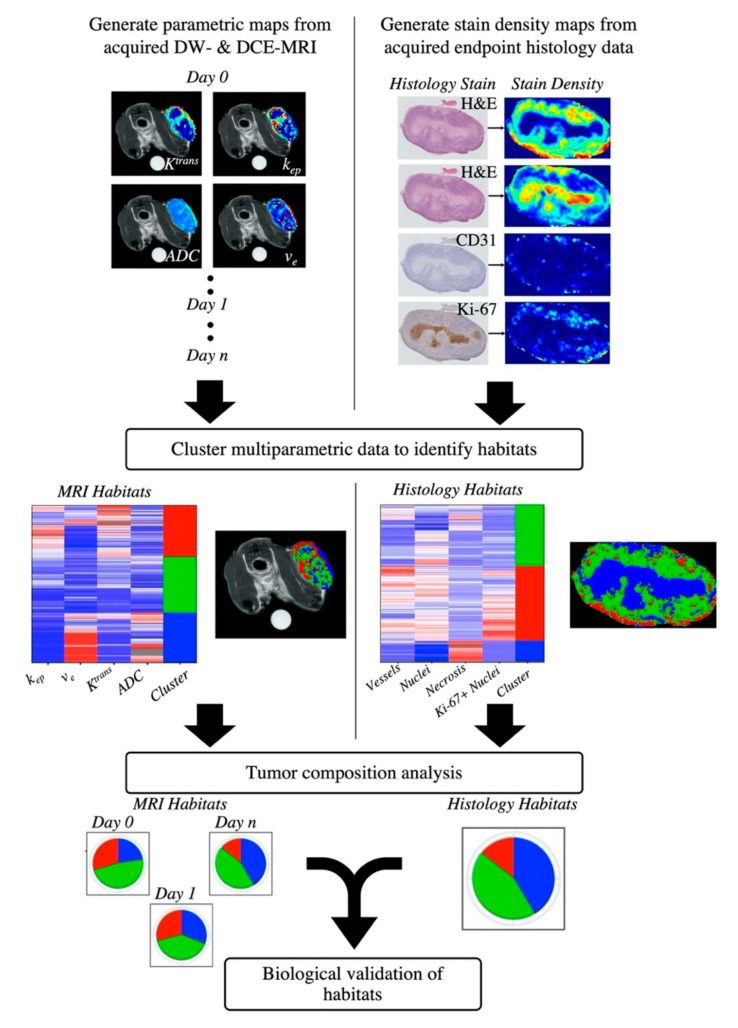
Figure 1.
Pipeline for the habitat imaging analysis. Longitudinal DCE- and DW-MRI data was acquired for each animal and processed to generate individual multi-parametric maps of the tumor region (top row, left). Each tumor voxel was then defined as a vector where each element corresponded to one of the parameters returned from the quantitative MRI analysis. Voxel data within each individual tumor cohort (BT-474 or MDA-MB-231) were pooled together. The pooled voxel data is then clustered to identify tumor habitats (middle row, left). Tumor composition over time was quantified in terms of the percent of each tumor’s volume having a particular habitat (bottom row, left). End point histology data was acquired and processed to generate stain density maps (top row, right). Each pixel was then defined as a vector of its stain density values and pixel data within each tumor cohort were pooled together. The pooled pixel data is clustered to identify histological tumor habitats (middle row, right). Histological tumor composition was then quantified in terms of the percent of each tumor’s area having a particular habitat (bottom row, right). To biologically validate imaging-derived habitats, a correlation analysis was performed between habitat percent tumor volume from the imaging-derived habitats, and habitat percent tumor area from the histology-derived habitats.

