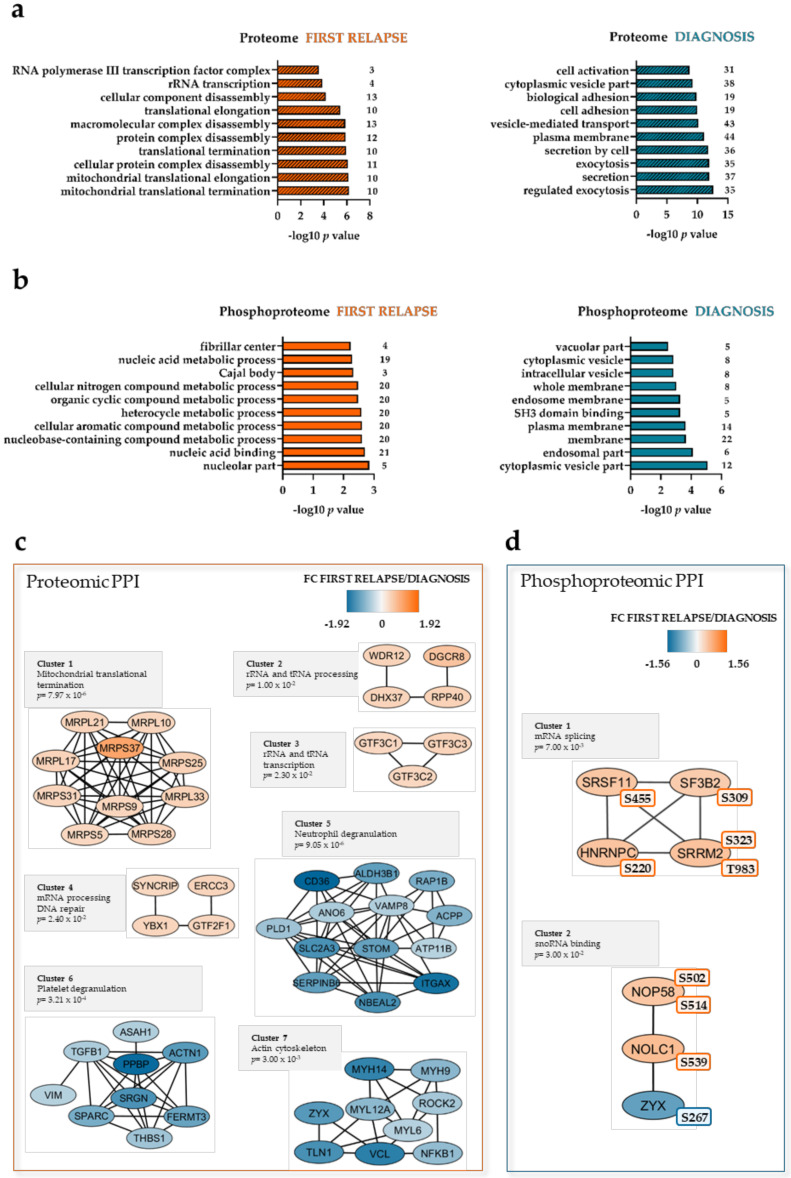
Figure 2.
The AML proteome and phosphoproteome are enriched in mitochondrial ribosomal, RNA-processing, and DNA repair proteins at first relapse. Gene ontology (GO) analysis was conducted for the proteome (a) and phosphoproteome (b), separately. Top 10 enriched GO categories are shown on the y-axis of each bar plot. The -log10 p values and the number of proteins associated with these GO categories are shown on the X-axis. Dashed bars represent GO categories that are also significantly enriched with false discovery rate (FDR) < 0.05. (c,d) Networks of protein–protein interactions (PPI) based on STRING search of the proteomic and phosphoproteomic datasets and visualized in Cytoscape after ClusterONE analysis. Significance of high cohesiveness of protein and phosphoprotein networks is shown by the p value of a one-sided Mann–Whitney U test. Fold changes (FCs) of protein expression or phosphorylation according to the super-SILAC (Stable Isotope Labeling with Amino acids in Cell culture) mix method are color-coded; orange-colored proteins showed a higher expression or phosphorylation in the FIRST RELAPSE group, and Yale blue-colored proteins showed a higher expression or phosphorylation in the DIAGNOSIS group. The differentially regulated phosphorylation site(s) is shown next to each phosphoprotein.

