Figure 2.
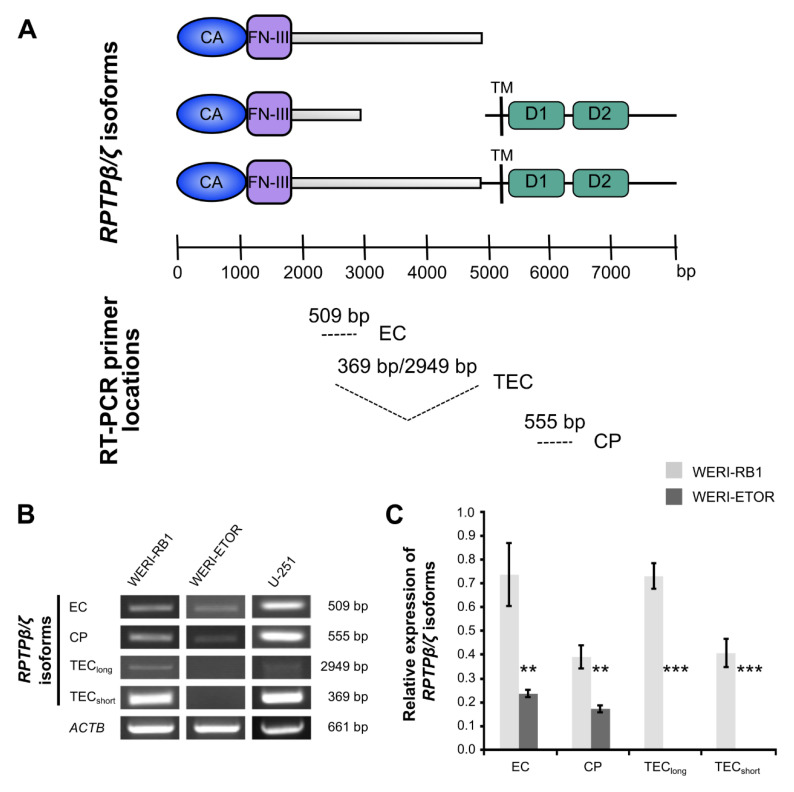
Semi-quantitative RT-PCR analyses of RPTPβ/ζ isoforms in WERI-RB1 compared to WERI-ETOR cells using various primer sets. (A) Scheme displays binding sites of specific RPTPβ/ζ (PTPRZ1) primer pairs for isoform amplification. All three of the RPTPβ/ζ isoforms, which were generated by alternative splicing, exhibit an extracellular carbonic anhydrase-like (CA) domain and Fibronectin-type-III (FN-III) repeats. A set of three distinct primers pairs (EC, TEC, and CP) marks the corresponding nucleotide sequence to demonstrate the resulting amplicon (modified according to Norman and colleagues [45]). (B) Using a set of three different primer pairs, the expression of RPTPβ/ζ isoforms was evaluated in both cell lines. The glioblastoma multiforme cell line U-251 served as positive control. The primer pair termed EC amplified a 509 bp product. This amplified product is part of all RPTPβ/ζ isoforms. A second primer pair, termed CP, amplified a 555 bp product, which corresponds to both RPTPβ/ζ receptor isoforms. Using this primer pair, expression of RPTPβ/ζlong/short was verified in WERI-RB1 cells. In contrast, only little, if any expression, was observed in WERI-ETOR cells. A third primer pair, termed TEC, amplified a 369 bp (RPTPβ/ζshort) as well as a 2949 bp (RPTPβ/ζlong) fragment. Both transcripts were verified in the WERI-RB1 line but were absent in the WERI-ETOR cell line. (C) Densitometric measurements of band intensities followed by semi-quantitative analyses and relative quantification (normalized to ACTB expression) revealed a significant downregulation of all RPTPβ/ζ isoforms in WERI-ETOR compared to WERI-RB1 cells. Values are shown as mean ± SD. ** p < 0.01; *** p < 0.001; n = 5/group.

