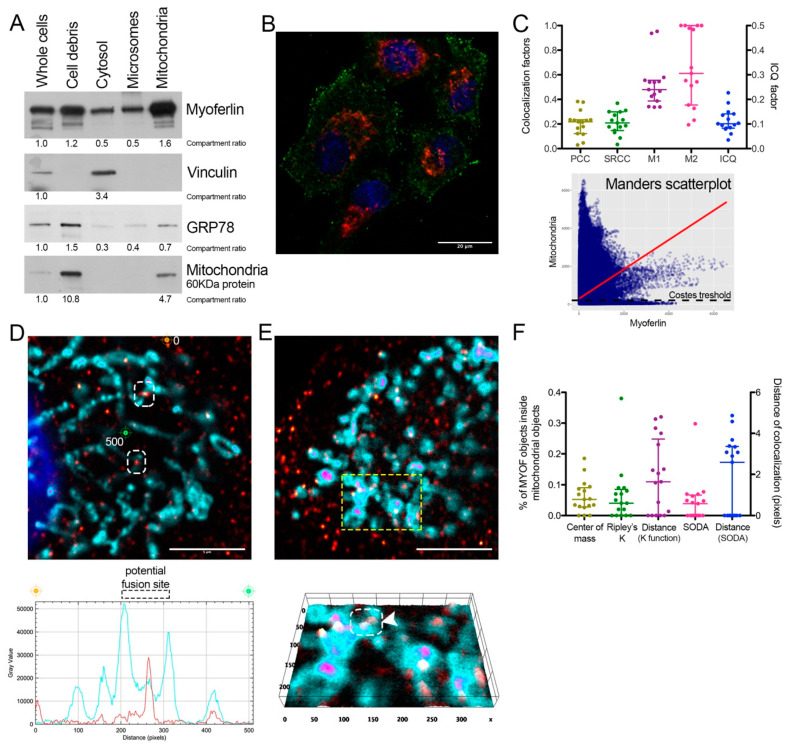
Figure 1.
Myoferlin was colocalized with mitochondria in Panc-1 cells. (A) Western blot of 6 µg protein samples from whole Panc-1 cells and several cellular compartments isolated from Panc-1 cells. Myoferlin, vinculin, GRP78, and a 60 kDa mitochondrial protein were detected on the same membrane. Compartment relative quantification was performed using ImageJ; (B) representative confocal image of nuclei (blue), myoferlin (K-16—green) and mitochondria (113-1—red) immunofluorescence. Scale bar = 20 µm; (C) Pearson (PCC), Spearman rank (SRCC) correlation coefficients, Manders’ colocalization coefficients (M1,M2), and intensity correlation quotient (ICQ) calculated on 17 independent microscopic fields. Manders scatterplot, associated with its linear regression (red line), shows the correlation between the intensity of each pixels in each channel. (D,E) Deconvoluted confocal image of nuclei (blue), myoferlin (K-16—“hot” red scale), mitochondria (113-1—“cold” cyan scale). Scale bar = 5 µm. Regions surrounded by white dashed boxes are putative mitochondrial fusion sites. (D) Channel intensity profile was established following the segment between orange (0-pixel position) and green (500-pixel position) cross marks; (E) The region surrounded by a yellow dashed box was used to generate the 2D intensity profile. Regions surrounded by white dashed box and marked by white arrow head is a putative mitochondrial fusion site; (F) percentage of myoferlin-positive objects (N = 4286) with the center of a mass overlapping mitochondrial object (N = 459), a percentage of myoferlin-positive object colocalizing mitochondrial object calculated by fitting of the Ripley’s K function or by statistical object distance analysis (SODA). Colocalization distances in pixels were measured in both cases. All experiments were performed as three independent biological replicates.

