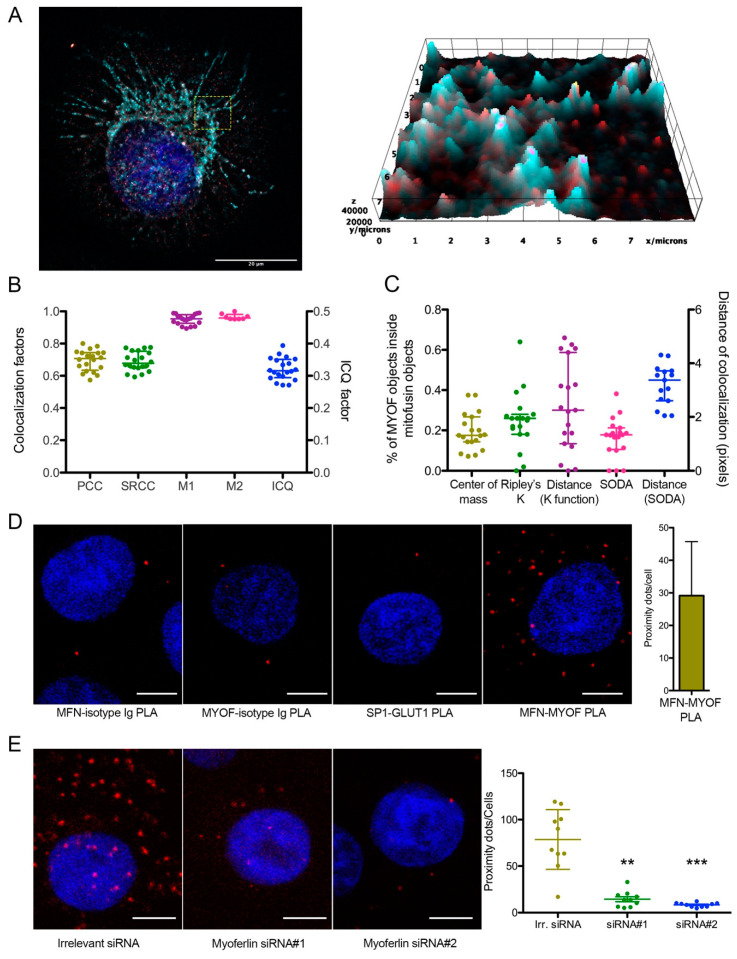
Figure 2.
Myoferlin was colocalized with mitochondrial fusion machinery. (A) Representative deconvoluted confocal image of nuclei (blue), myoferlin (K16—“hot” red scale) and mitofusin-1 (H65—“cold” cyan scale) immunofluorescence. Scale bar = 20 µm. Region surrounded by yellow dashed box was used to generate the 2D intensity profile; (B) Pearson (PCC), Spearman rank (SRCC) correlation coefficients, Manders’ colocalization coefficients (M1,M2), and intensity correlation quotient (ICQ) were calculated on 20 independent microscopic fields randomly selected; (C) percentage of myoferlin-positive objects (N = 7128) with center of mass overlapping mitochondrial object (N = 369), percentage of myoferlin-positive object colocalizing mitochondrial object calculated by fitting of the Ripley’s K function or by statistical object distance analysis (SODA). Colocalization distances in pixels were measured in both cases; (D) representative images of proximity ligation assay (PLA) between myoferlin (HPA) and mitofusin-1/2 (3C9). Scale bar = 4 µm. Controls were established by substitution of antibodies by control isotypes or by using antibodies against non-interacting proteins (SP1 and GLUT1); (E) representative images of PLA in Panc-1 cells transfected with irrelevant or myoferlin-specific siRNA. Scale bar = 4 µm. MFN1/2-MYOF PLA (N = 10) were quantified using ImageJ. Kruskal–Wallis non-parametric test followed by Dunn’s pairwise comparison was performed, ** p < 0.01, *** p < 0.001. All experiments were performed as three independent biological replicates.

