
Figure 1.
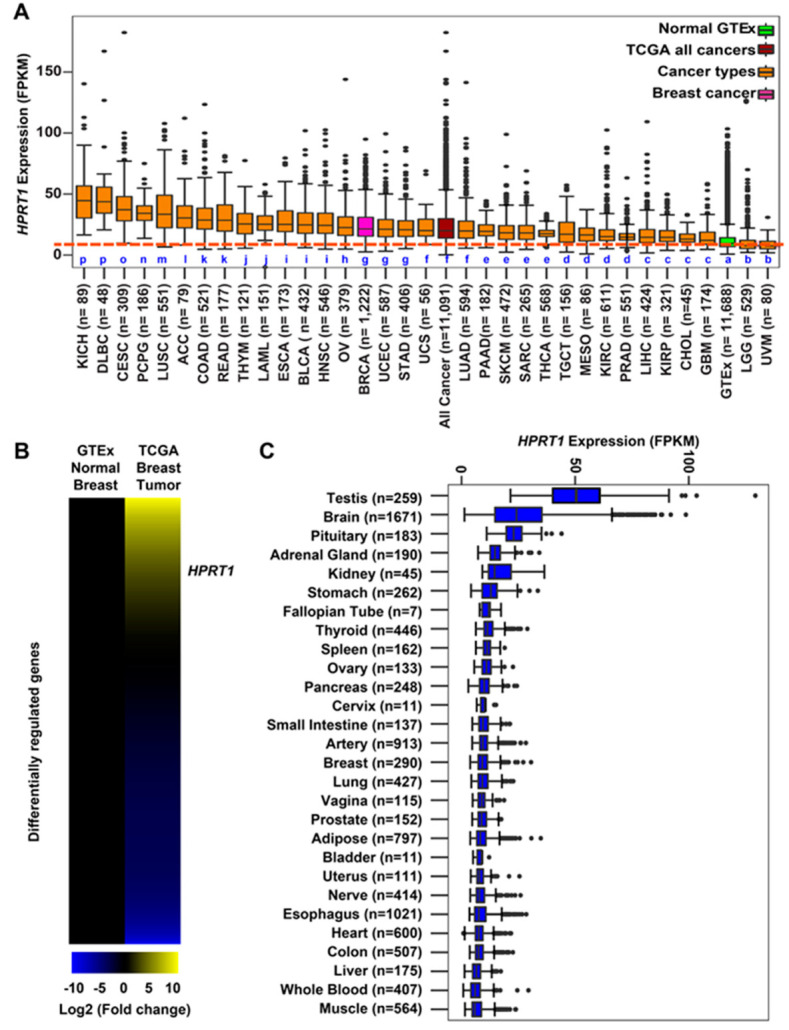
Hypoxanthine phosphoribosyl transferase 1 (HPRT1) expression across multiple cancer types. (A) Expression of HPRT1 (fragments per kilobase of million mapped reads (FPKM)) comparing all cancer types from The Cancer Genome Atlas (TCGA) (Table S1), aggregate TCGA samples, and normal samples from Genotype-Tissue Expression (GTEx). Box plots marked with different letters in blue (a, b, c, d, e, f, g, h, i, j, k, l, m, n, o, and p) are significantly different from each other (Wilcoxon rank-sum test). (B) Heatmap depicting differential expression of genes (HPRT1–labeled) comparing normal breast tissue from GTEx against breast tumor samples from TCGA. The scale goes from bright blue to bright yellow corresponding to the log2 fold change (−10 to 10, respectively). (C) Expression of HPRT1 (FPKM) in normal tissue samples from GTEx.