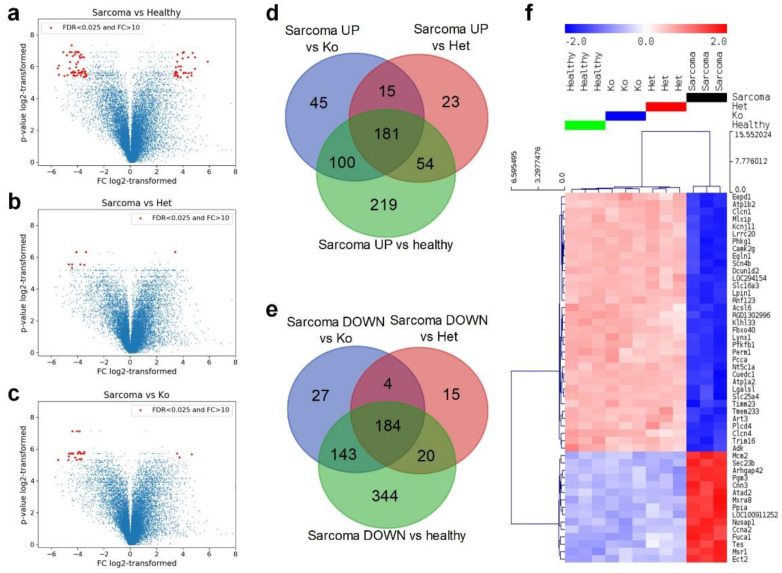
Figure 4.
Comparison of gene expression and its overlap in four groups of rats. Volcano plots of gene expression in rats with sarcoma and all other groups: healthy (a), heterozygous knockout (d), total knockout (c). In panels (a–c), the horizontal axis presents log2-transformed fold change of gene expression, while the vertical axis presents log2-transformed p-value (after FDR correction). Venn diagrams of genes upregulated in sarcoma rats versus healthy controls and rats with heterozygous and total knockout (d), genes downregulated in sarcoma rats versus healthy controls and rats with heterozygous and total knockout (e). Hierarchical clustering of the top 50 differentially expressed genes (lowest FDR in ANOVA), Euclidean distance, linkage method: average, row-standardized (f).

