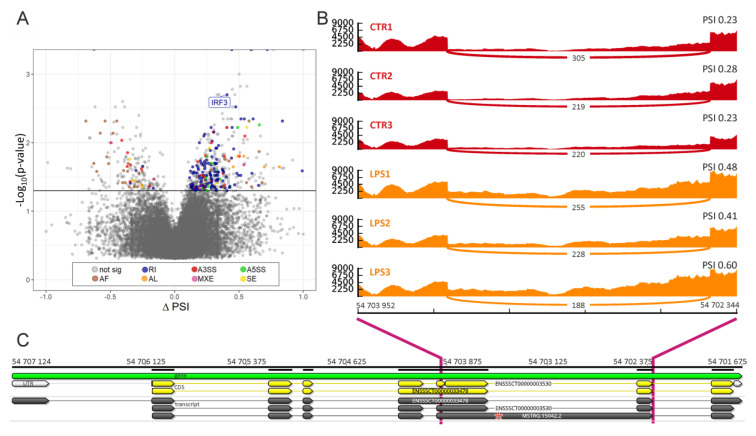
Figure 5.
The distribution of differentially alternative splicing (DAS) events. (A) Volcano plot shows the difference in the percent splicing inclusion (ΔPSI) values in each alternative splicing (AS) event (X axis) and the Y axis depicts the logarithmic adjusted p-values. The horizontal line describes adjusted p-values cut-off (0.05). Colors of the dots indicate specific types of DAS: skipping exon (SE—yellow), alternative 5′ splice site (A5SS—green), alternative 3′ splice site (A3SS—red), mutually exclusive exons (MXE—pink), retained intron (RI—blue), alternative first (AF—brown), last exon (AL—orange), and not a significant event (grey). (B) Quantitative visualization (Sashimi plot) of the intron 5 (I5) retention within the IRF3 gene. Each track visualizes the splicing event (RI of I5) within the biological replicates for the control (red) and LPS-treated (orange) samples. Count values on curved lines describe the coverage within the splice junction. The left scale presents the coverage depth of IRF3 in the range of the AS region. PSI values are presented on the right side for each track. (C) Genomic coordinates of the DAS event within IRF3 located on chromosome 6. Yellow tracks show 2 known ENSEMBL coding regions (CDS) of the IRF3 gene. Grey tracks show 2 known and 1 novel transcripts of IRF3 identified in our study. Red star shows the position of the stop codon in the alternative spliced IRF3 mRNA (MSTRG.15042.2) after intron retention.

