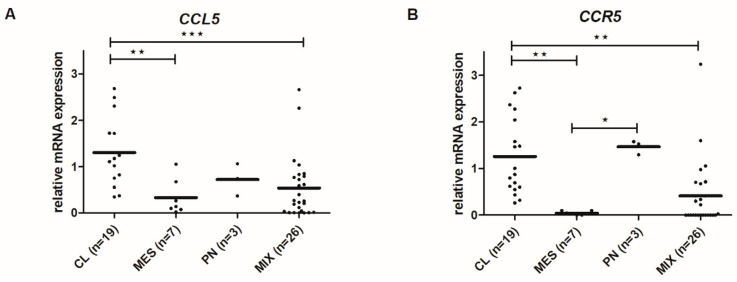
Figure 8.
CCL5 and CCR5 gene expression in glioblastoma subtypes. mRNA expression of CCL5 (A) and CCR5 (B) in glioblastoma tissues and glioblastoma cells analyzed by RT-qPCR. mRNA values were normalized to housekeeping genes HPRT1 and GAPDH and analyzed with quantGenius software as described in Materials and Methods. n-number of samples; CL-classical, MES-mesenchymal, PN-proneural, and MIX subtypes. ★ p < 0.05, ★★ p < 0.01, ★★★ p < 0.001 versus the non-cancerous brain tissues.

